Case Study | Early Access Launch
At Antenna Labs, we created an analytics tool for Twitch broadcasters to deliver insights and personalized recommendations for their content, so that they can make informed decisions about their businesses instead of relying on guesswork. We began with user research and prototype testing in the spring/summer 2019, leading up to our MVP launch in August to an initial cohort of broadcasters. Through subsequent user testing and feedback, we iterated on the existing feature set and added new visualizations, leading to a retention rate increase of +32% for our second cohort.
Market opportunity
Twitch provides their own channel analytics to broadcasters, but focuses primarily on raw numbers and often shallow metrics. Even the stats expected to be reported on, such as "average viewers" do not give broadcasters the full story - of those viewers, how many are new to their channel? How many will likely convert into recurring viewers? What is the relationship between engagement and subscriptions? Answers to these questions can inform the broadcaster's business strategy.
Our product targets serious broadcasters who approach streaming as a full-time or part-time business. They want to grow their stream to a point such that it becomes a reliable source of recurring income, but the available tools that deliver their stream data leaves them in the dark as to how to approach this vision.
Twitch channel analytics
Our approach
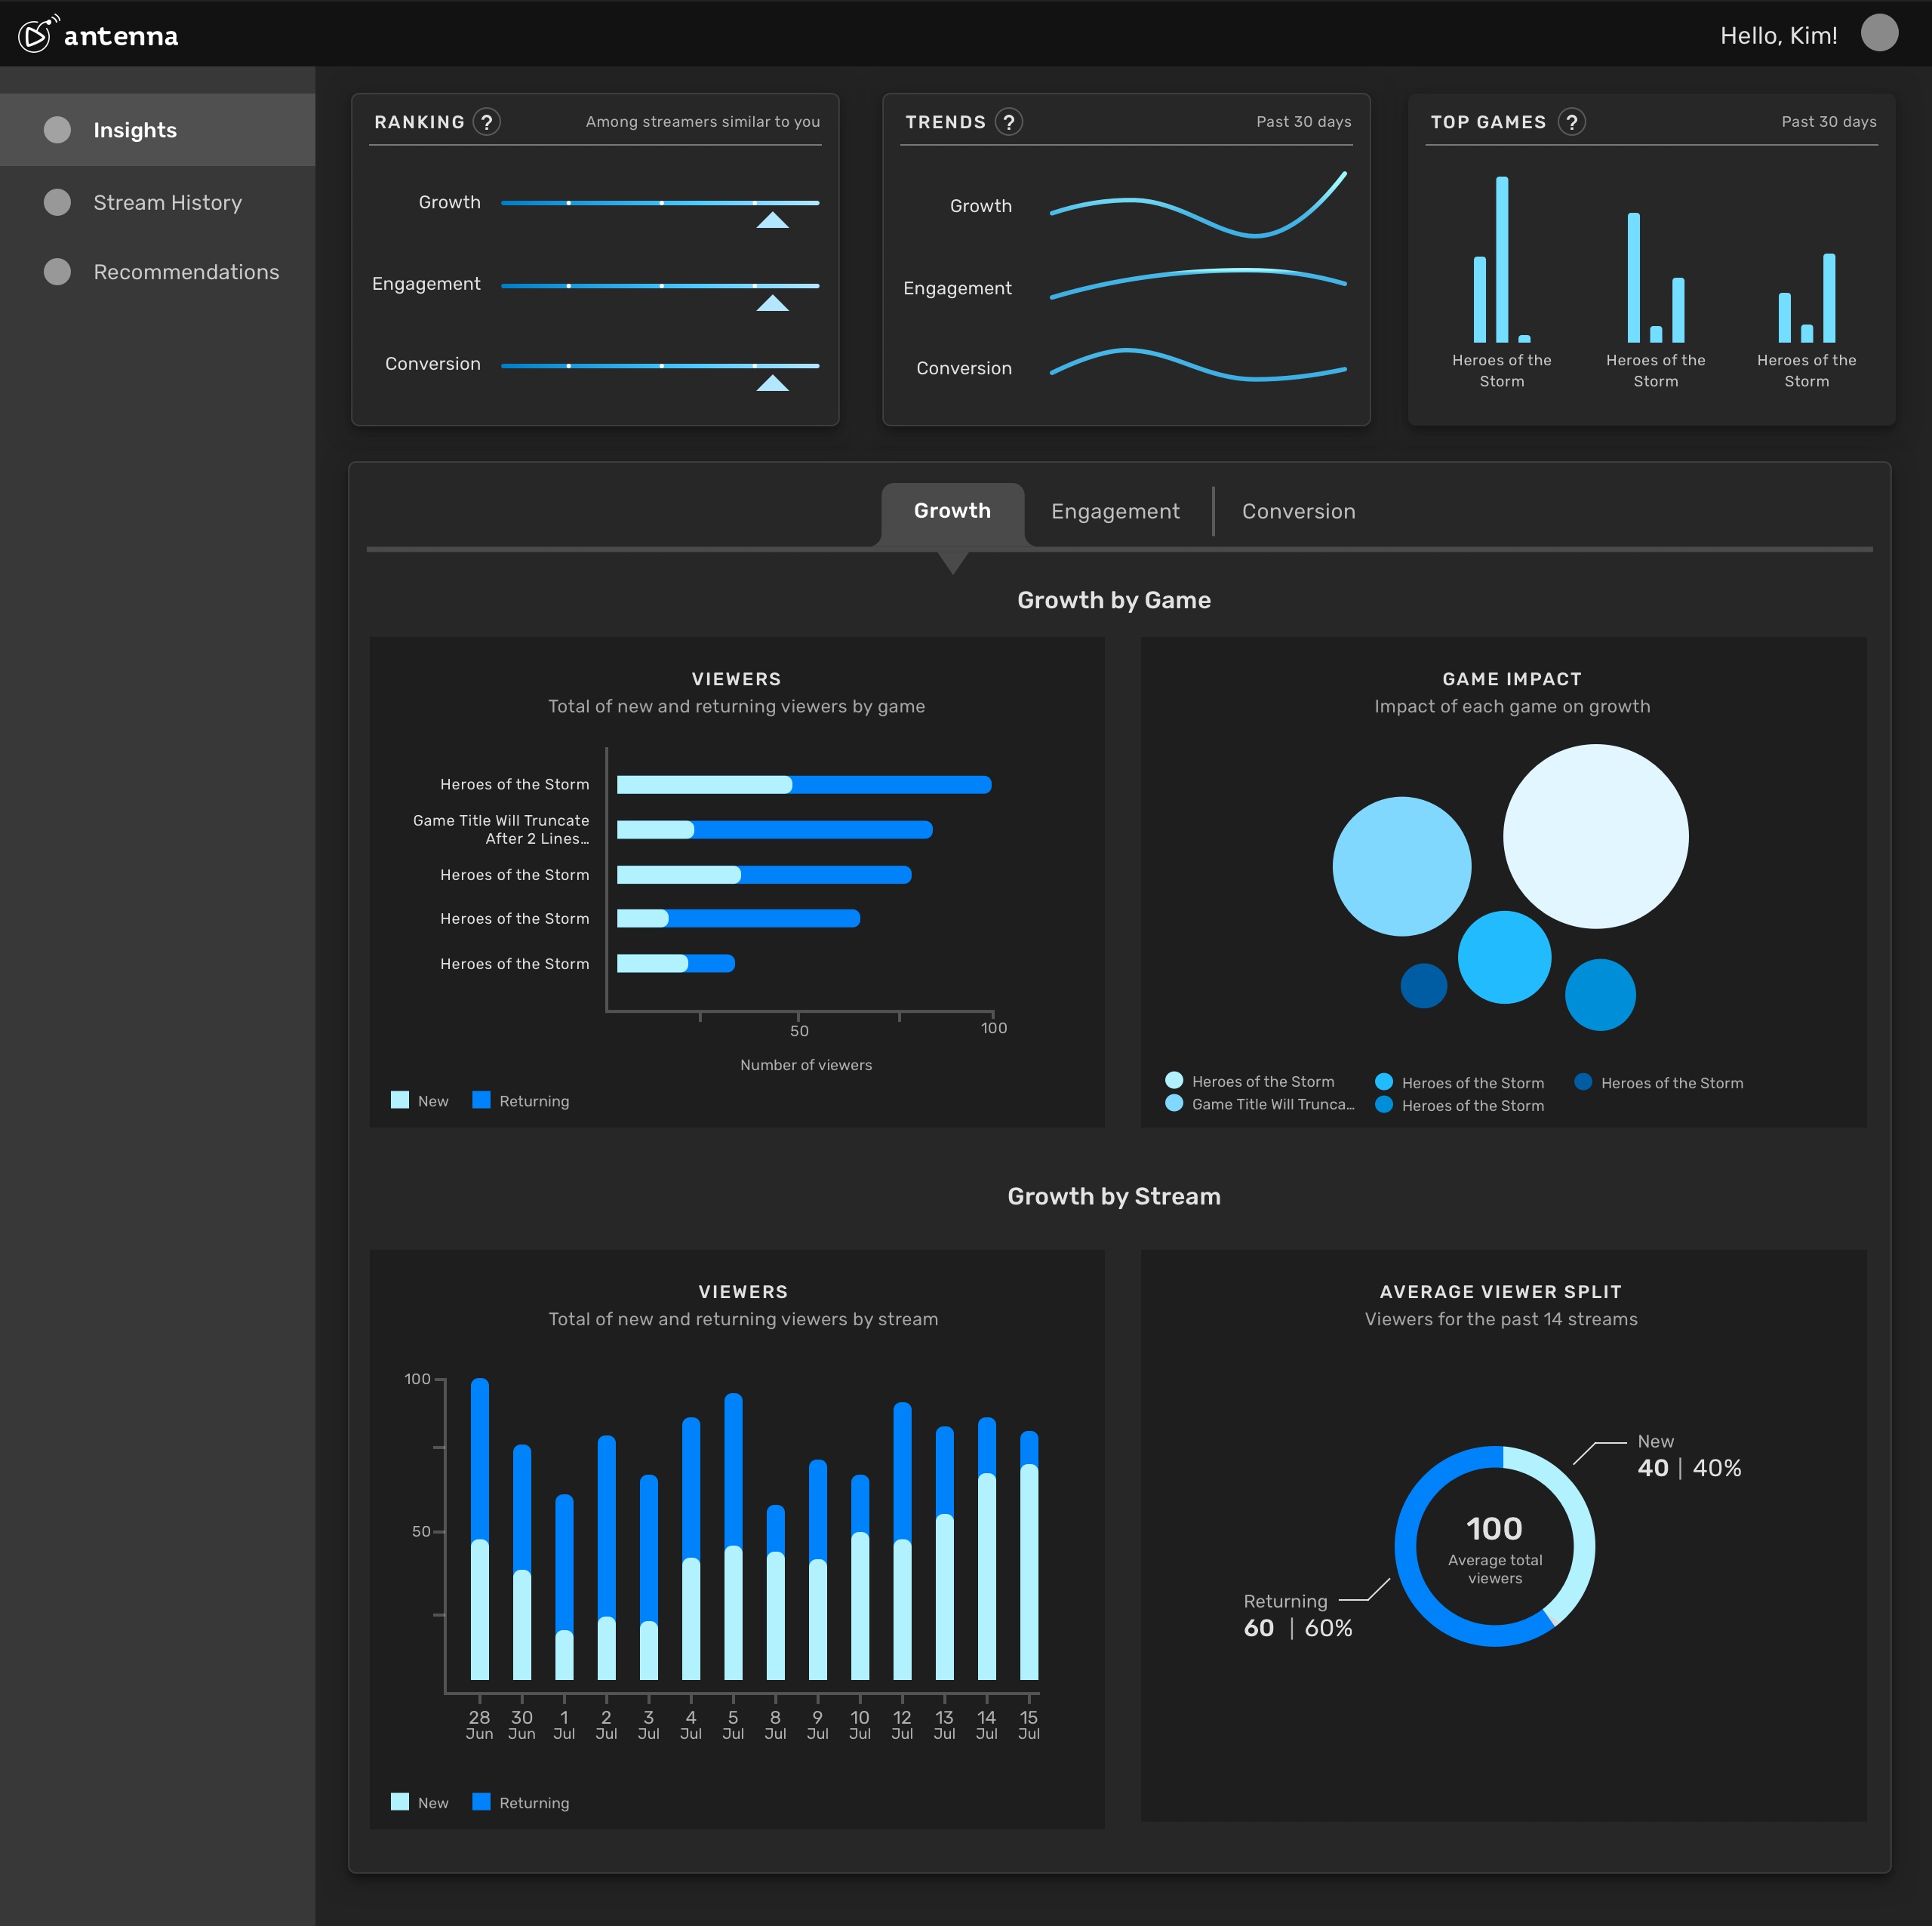
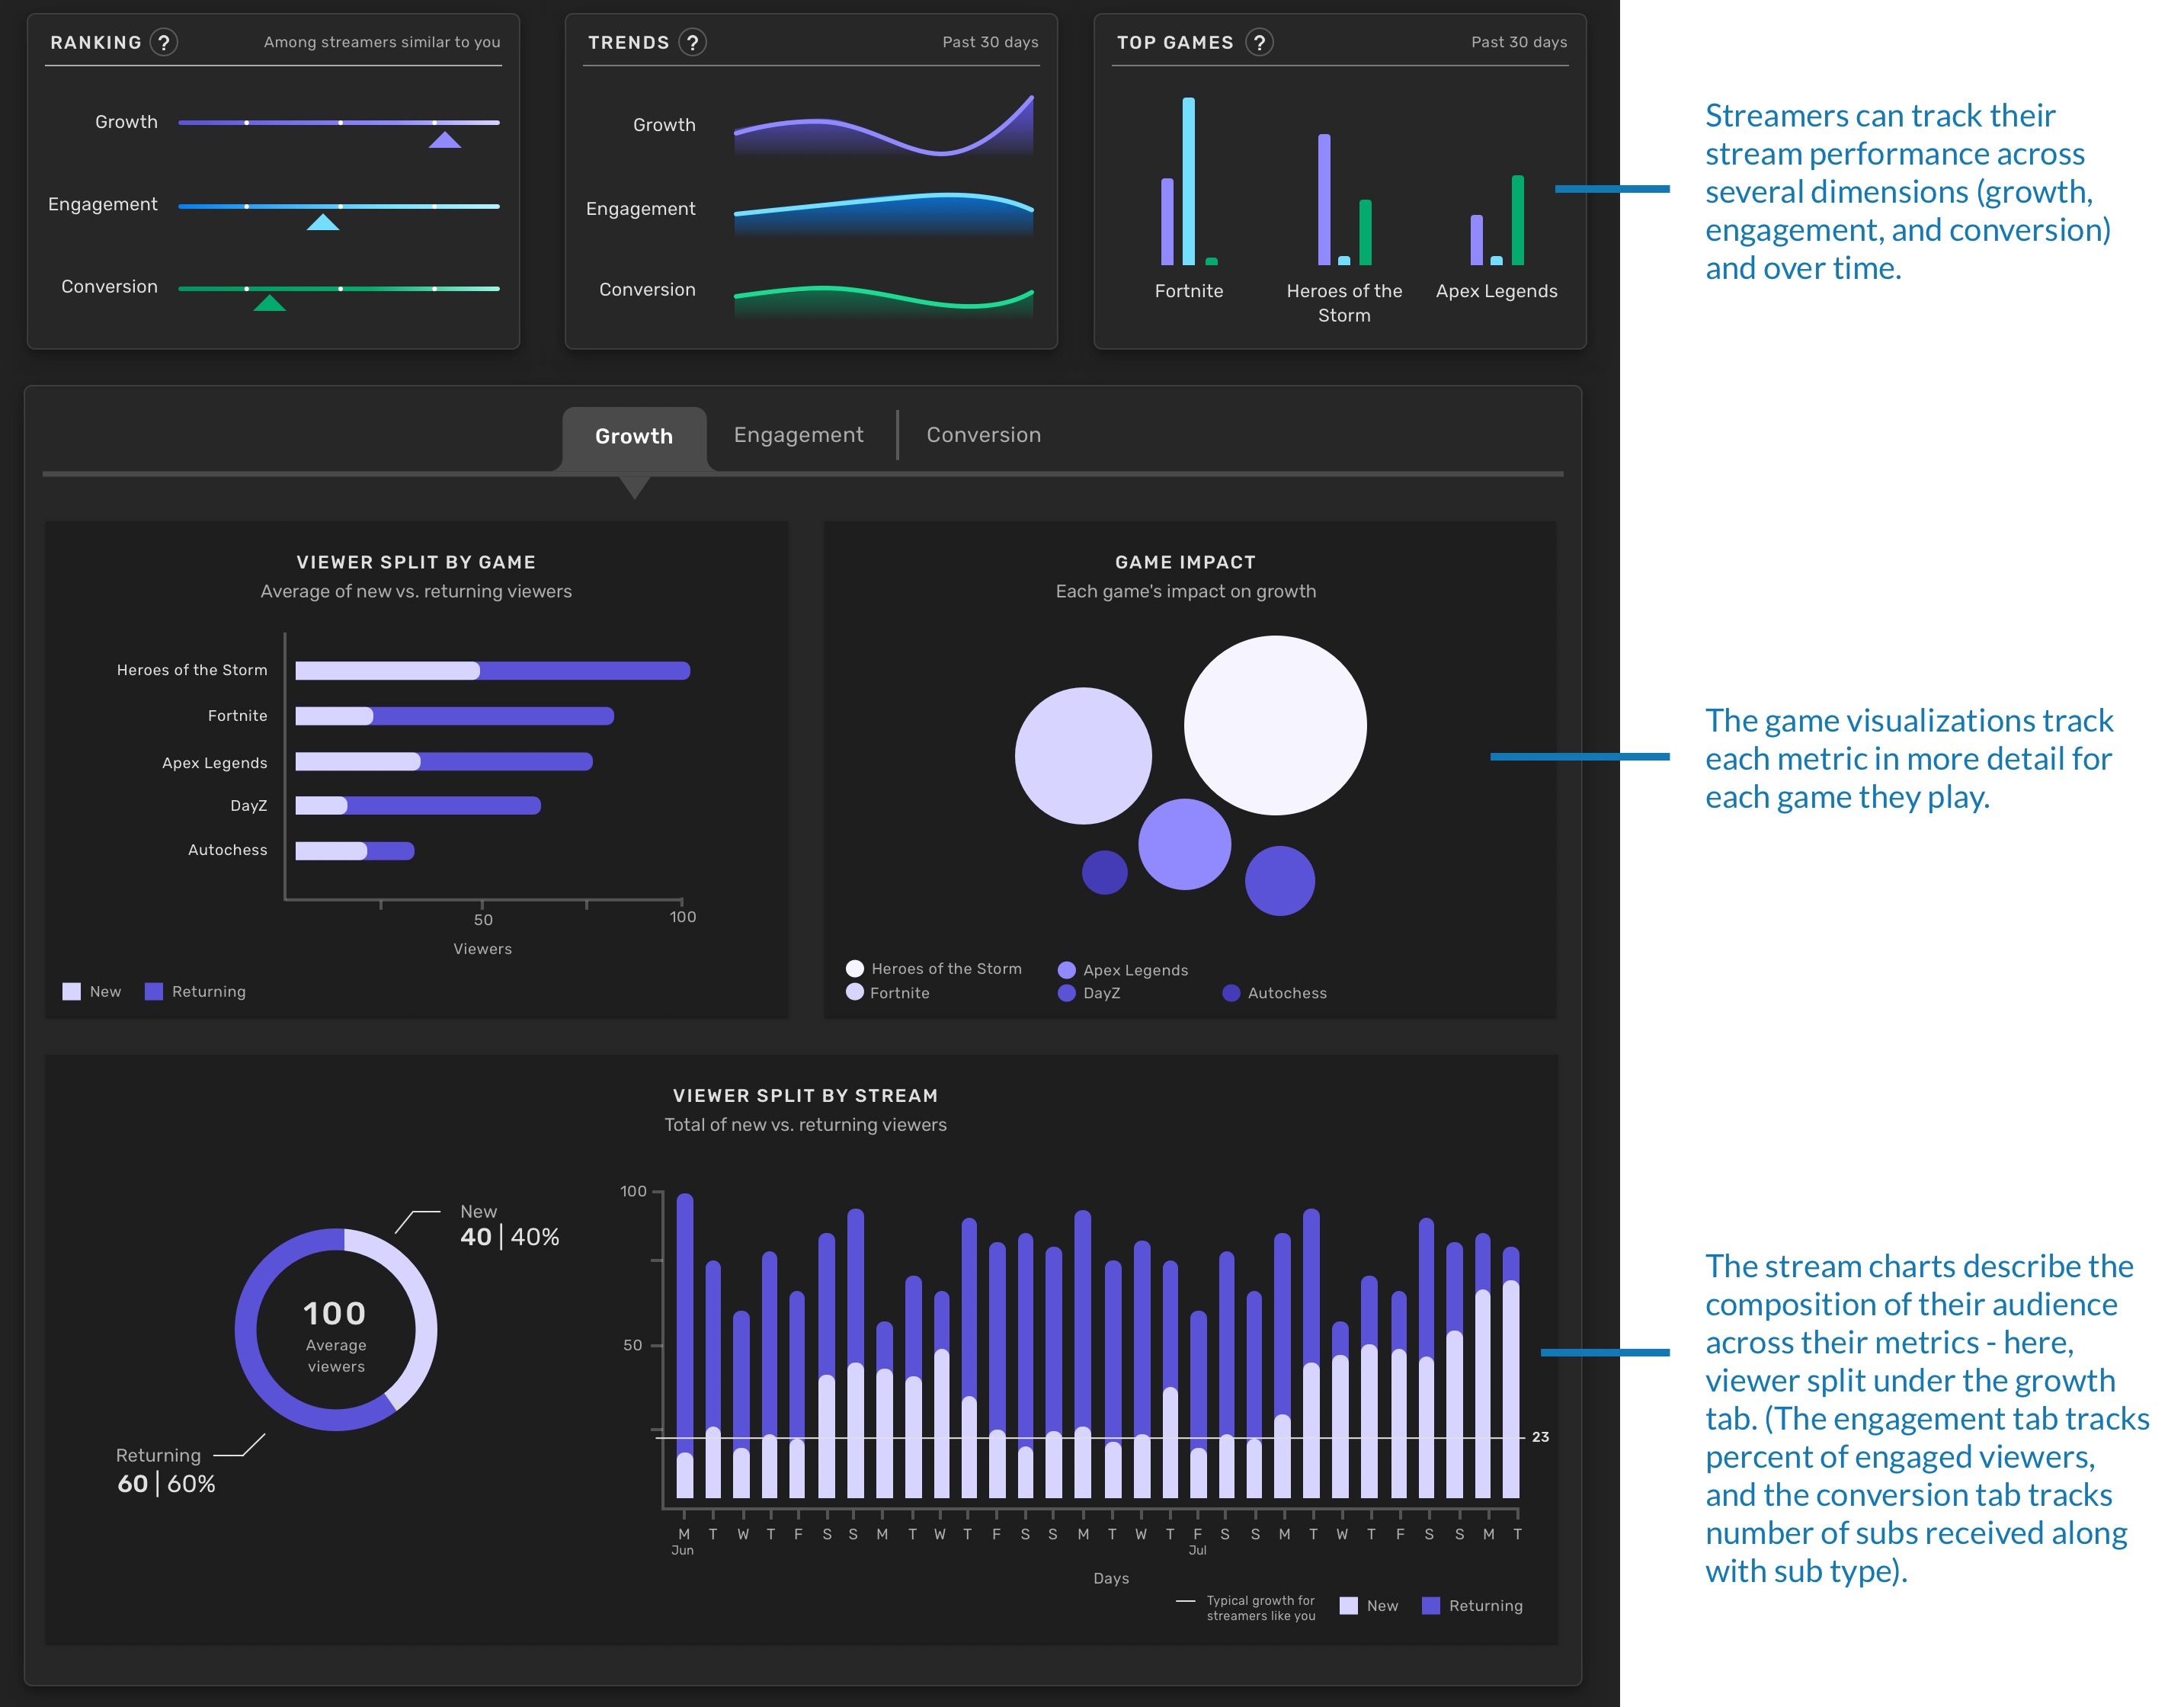
Using Twitch’s API, our approach turns raw numbers into data visualizations that reflect their stream in ways they're already thinking about their business. - growth (the direction viewership is moving), engagement (viewers active in the community chat), and conversion (subscribers). We also provide a detailed breakdown of how the games they impact their stream.
We launched this MVP in August 2019 with this set of visualizations, with personalized recommendations to follow.
Antenna product screen
Research & Prototyping
Our MVP objective was to release a product quickly that we could then learn from and iterate on. To begin, we conducted user interviews and ran two rounds of prototyping over the course of a month. These prototypes were tested with broadcasters who would become a part of our initial cohort, with their real user data.
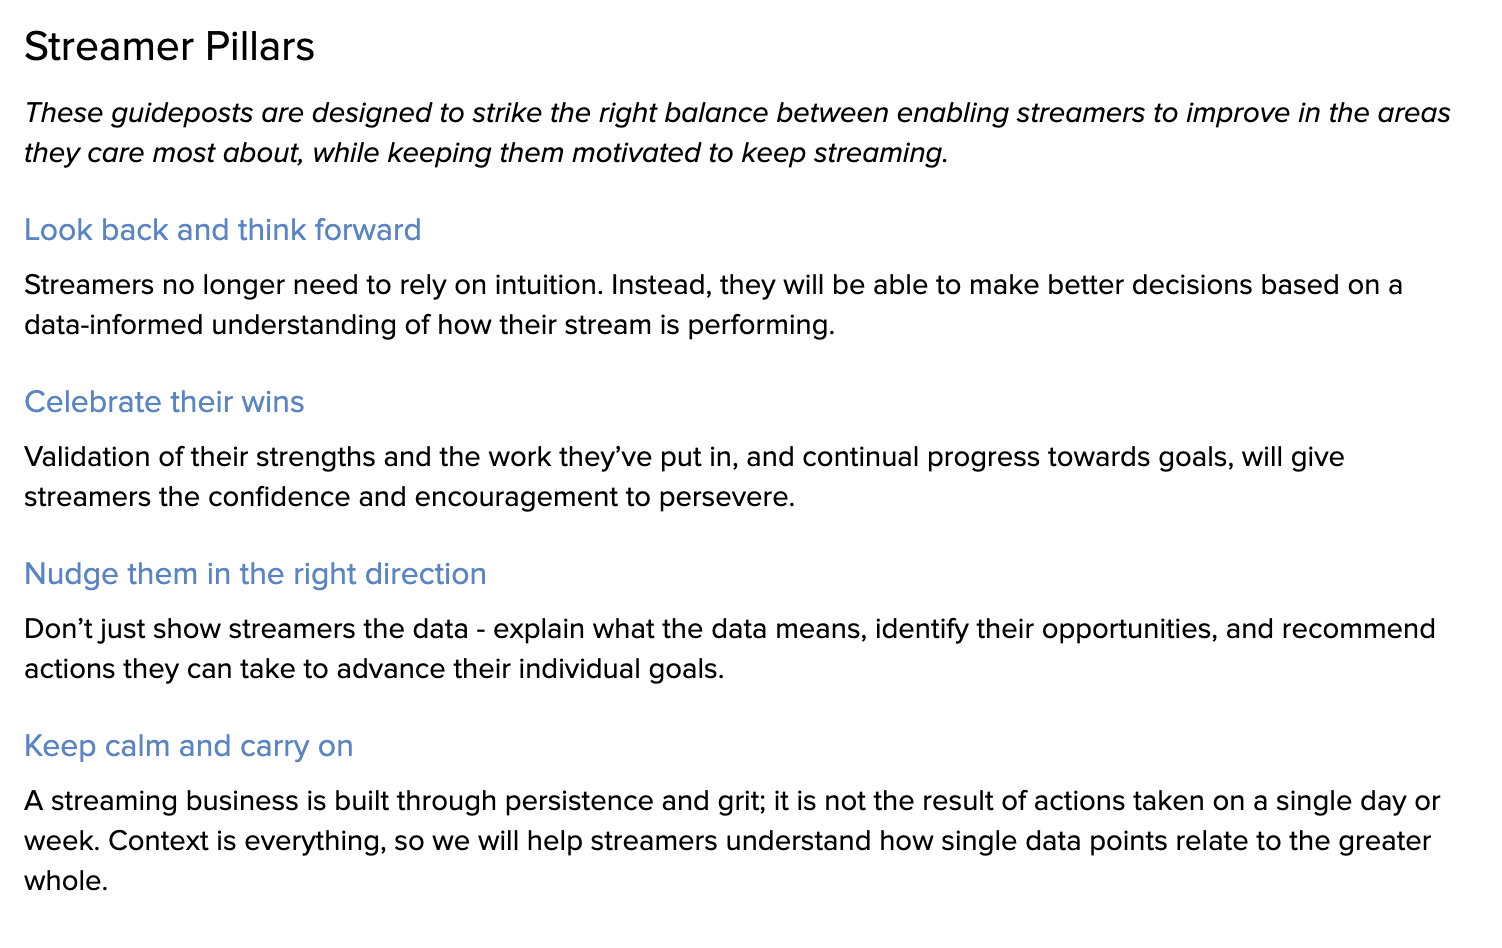
Product Pillars
As we built up our foundational research and learnings from the prototyping, we created an initial set of product pillars.
Prototype 1
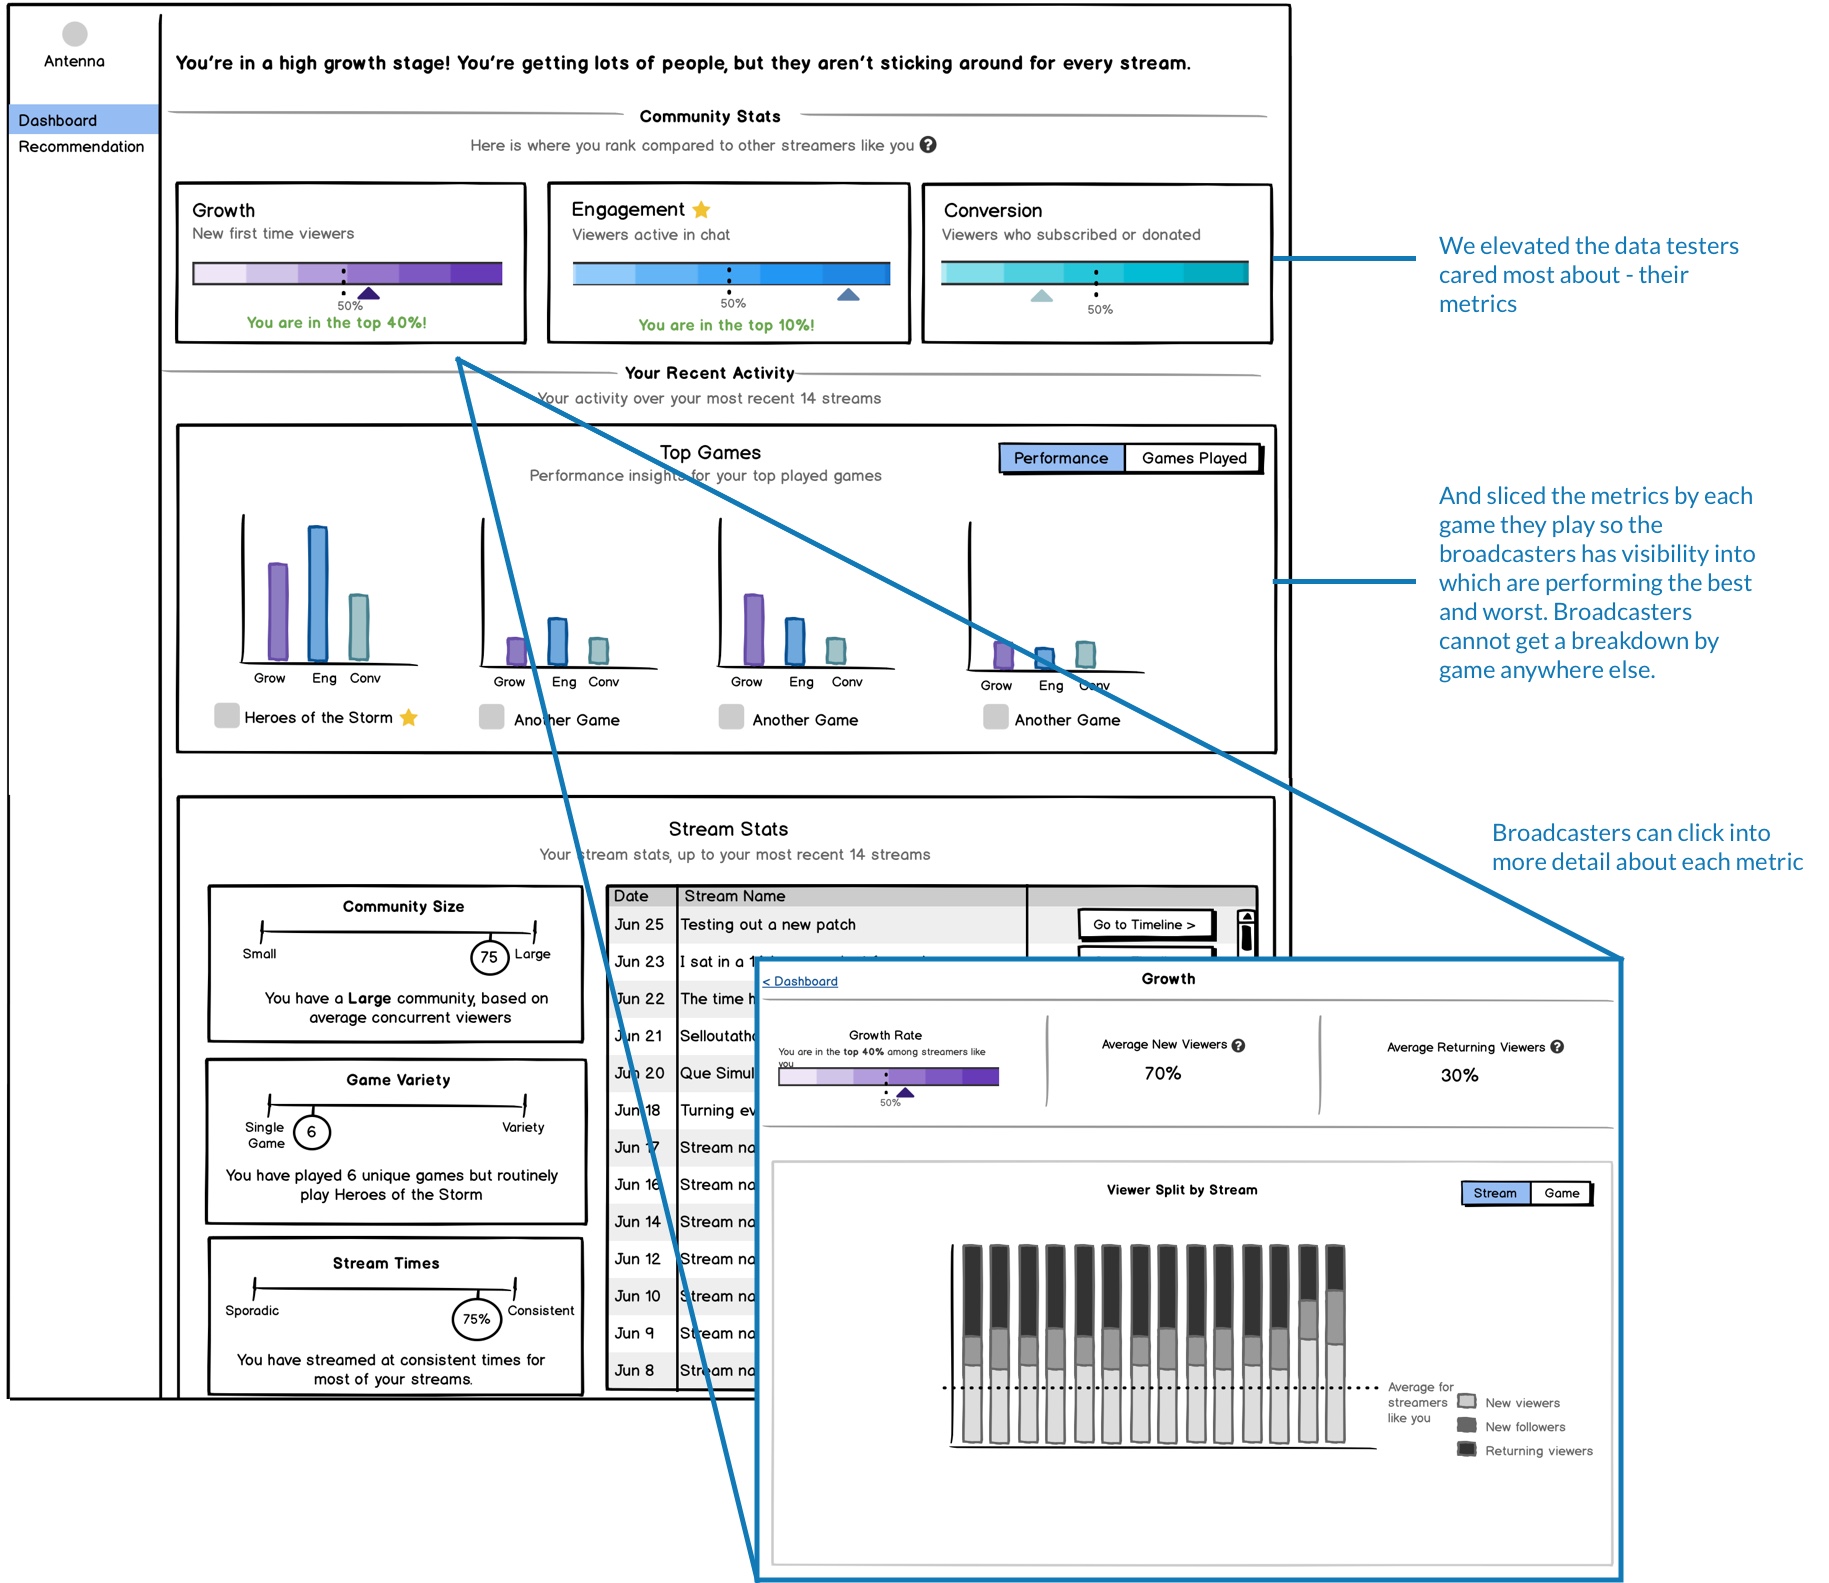
Our primary prototyping goals was to test the presentation of data in order to learn which types of insights broadcasters found most valuable and actionable. We didn't spend much time worrying about layout or visual design problems just yet.
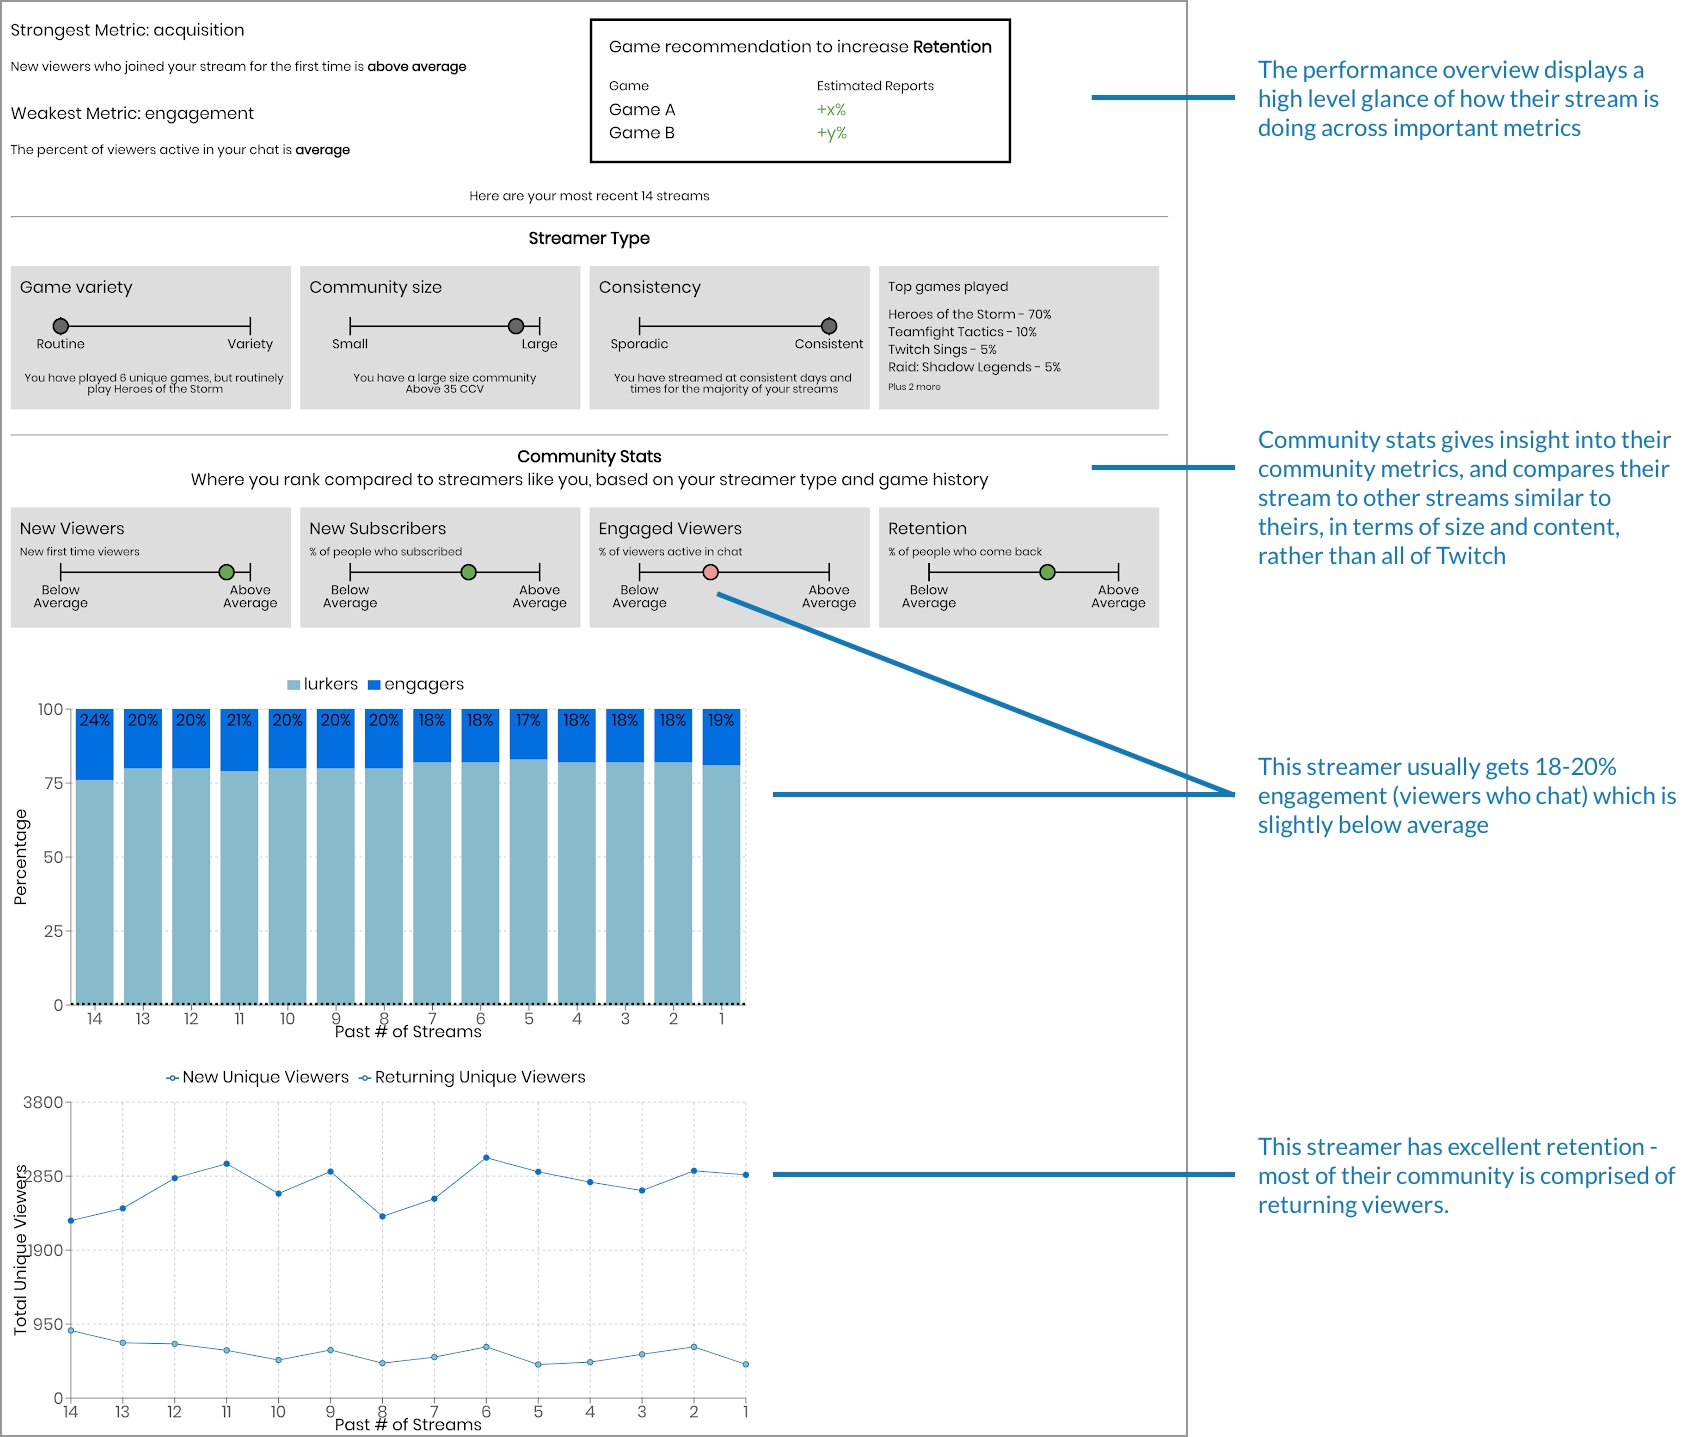
Prototype 1 - screenshot with live user data
In testing this prototype, we learned Testers cared most about their high level business metrics - acquisition, retention, engagement, conversion - because it showed them areas they excelled at (motivation to keep going) and areas to work on, and cared less about insight into their streamer type and community because it wasn’t as actionable. Testers also consistently asked for visibility into how the games they play impact their stream and metrics --
“What game should I play?” is the most common question streamers ask themselves and others.
Prototype 2
The results of the first prototype test led to a 2nd prototype iteration, again tested with real user data.
Prototype 2 - wireframe
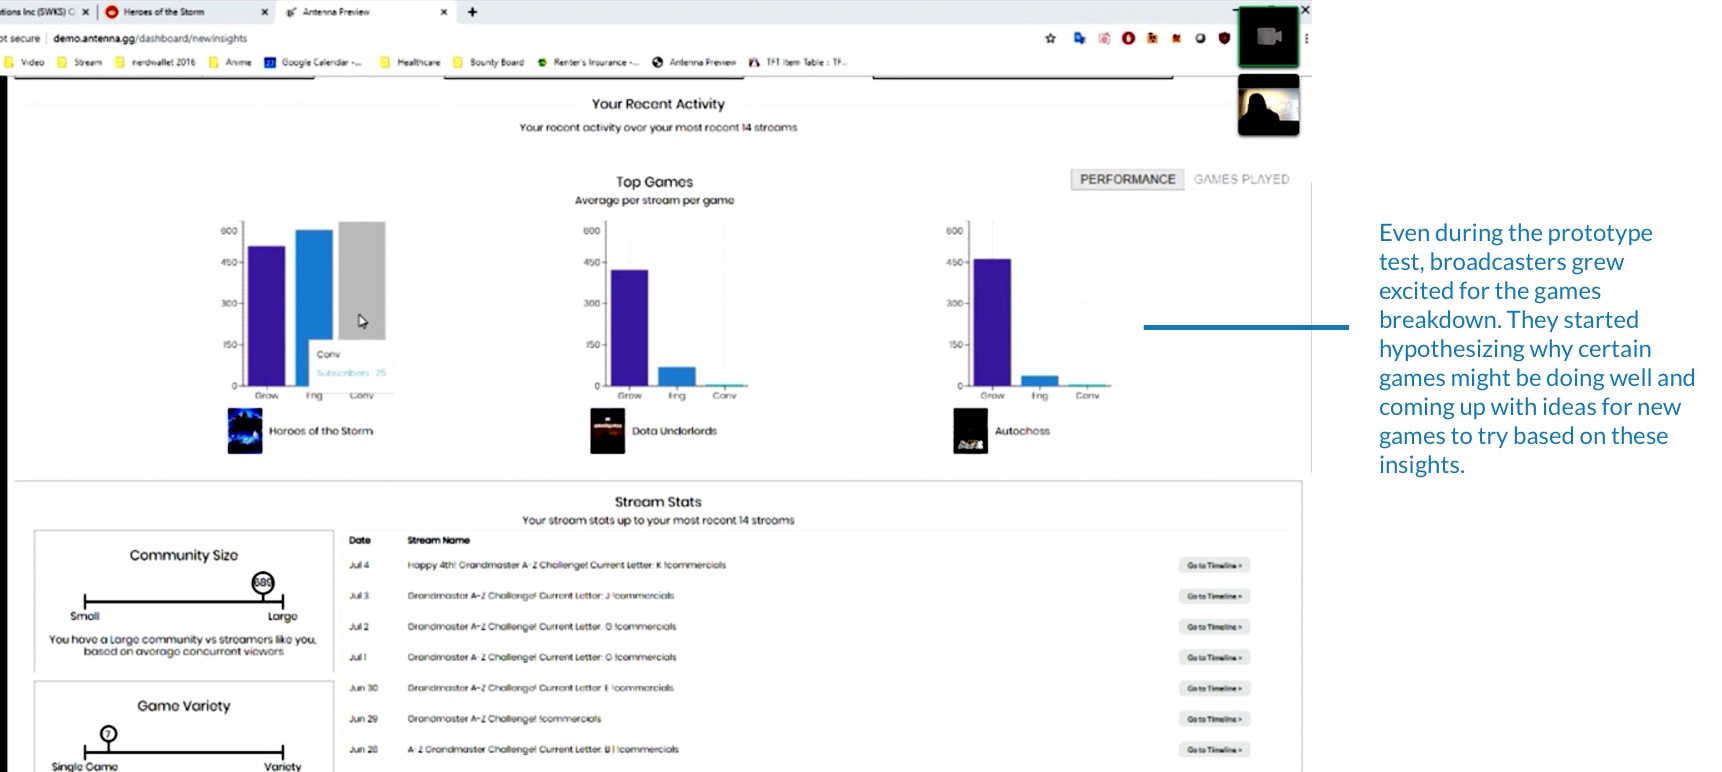
Prototype 2 - screenshot from prototype test recording, using live user data
In the second prototype test, we learned the games breakdown graphs we were experimenting with was viewed as a differentiating factor, as no other streaming tracker tool provides that breakdown. We also learned that drilling into top level metrics was overkill for the amount of data we would launch with, and community insight was still relatively unimportant compared to the rest of the visualizations on the dashboard, so we cut those two features from the MVP for now.
MVP Development
After the prototyping phase, the team and I worked together to define requirements and scope for our MVP.
Layout and Feature Definition
Wireframe sample
Visual Development
Dark mode
Since dark mode UI is heavily preferred by our target market, we designed a dark mode from the start. This also takes into account situational context - if they are using Antenna while broadcasting, it would be distracting to have a light UI blast their eyes among the dark UI every other streaming tool uses, and may also interfere with their lighting setup.
Visual development in progress
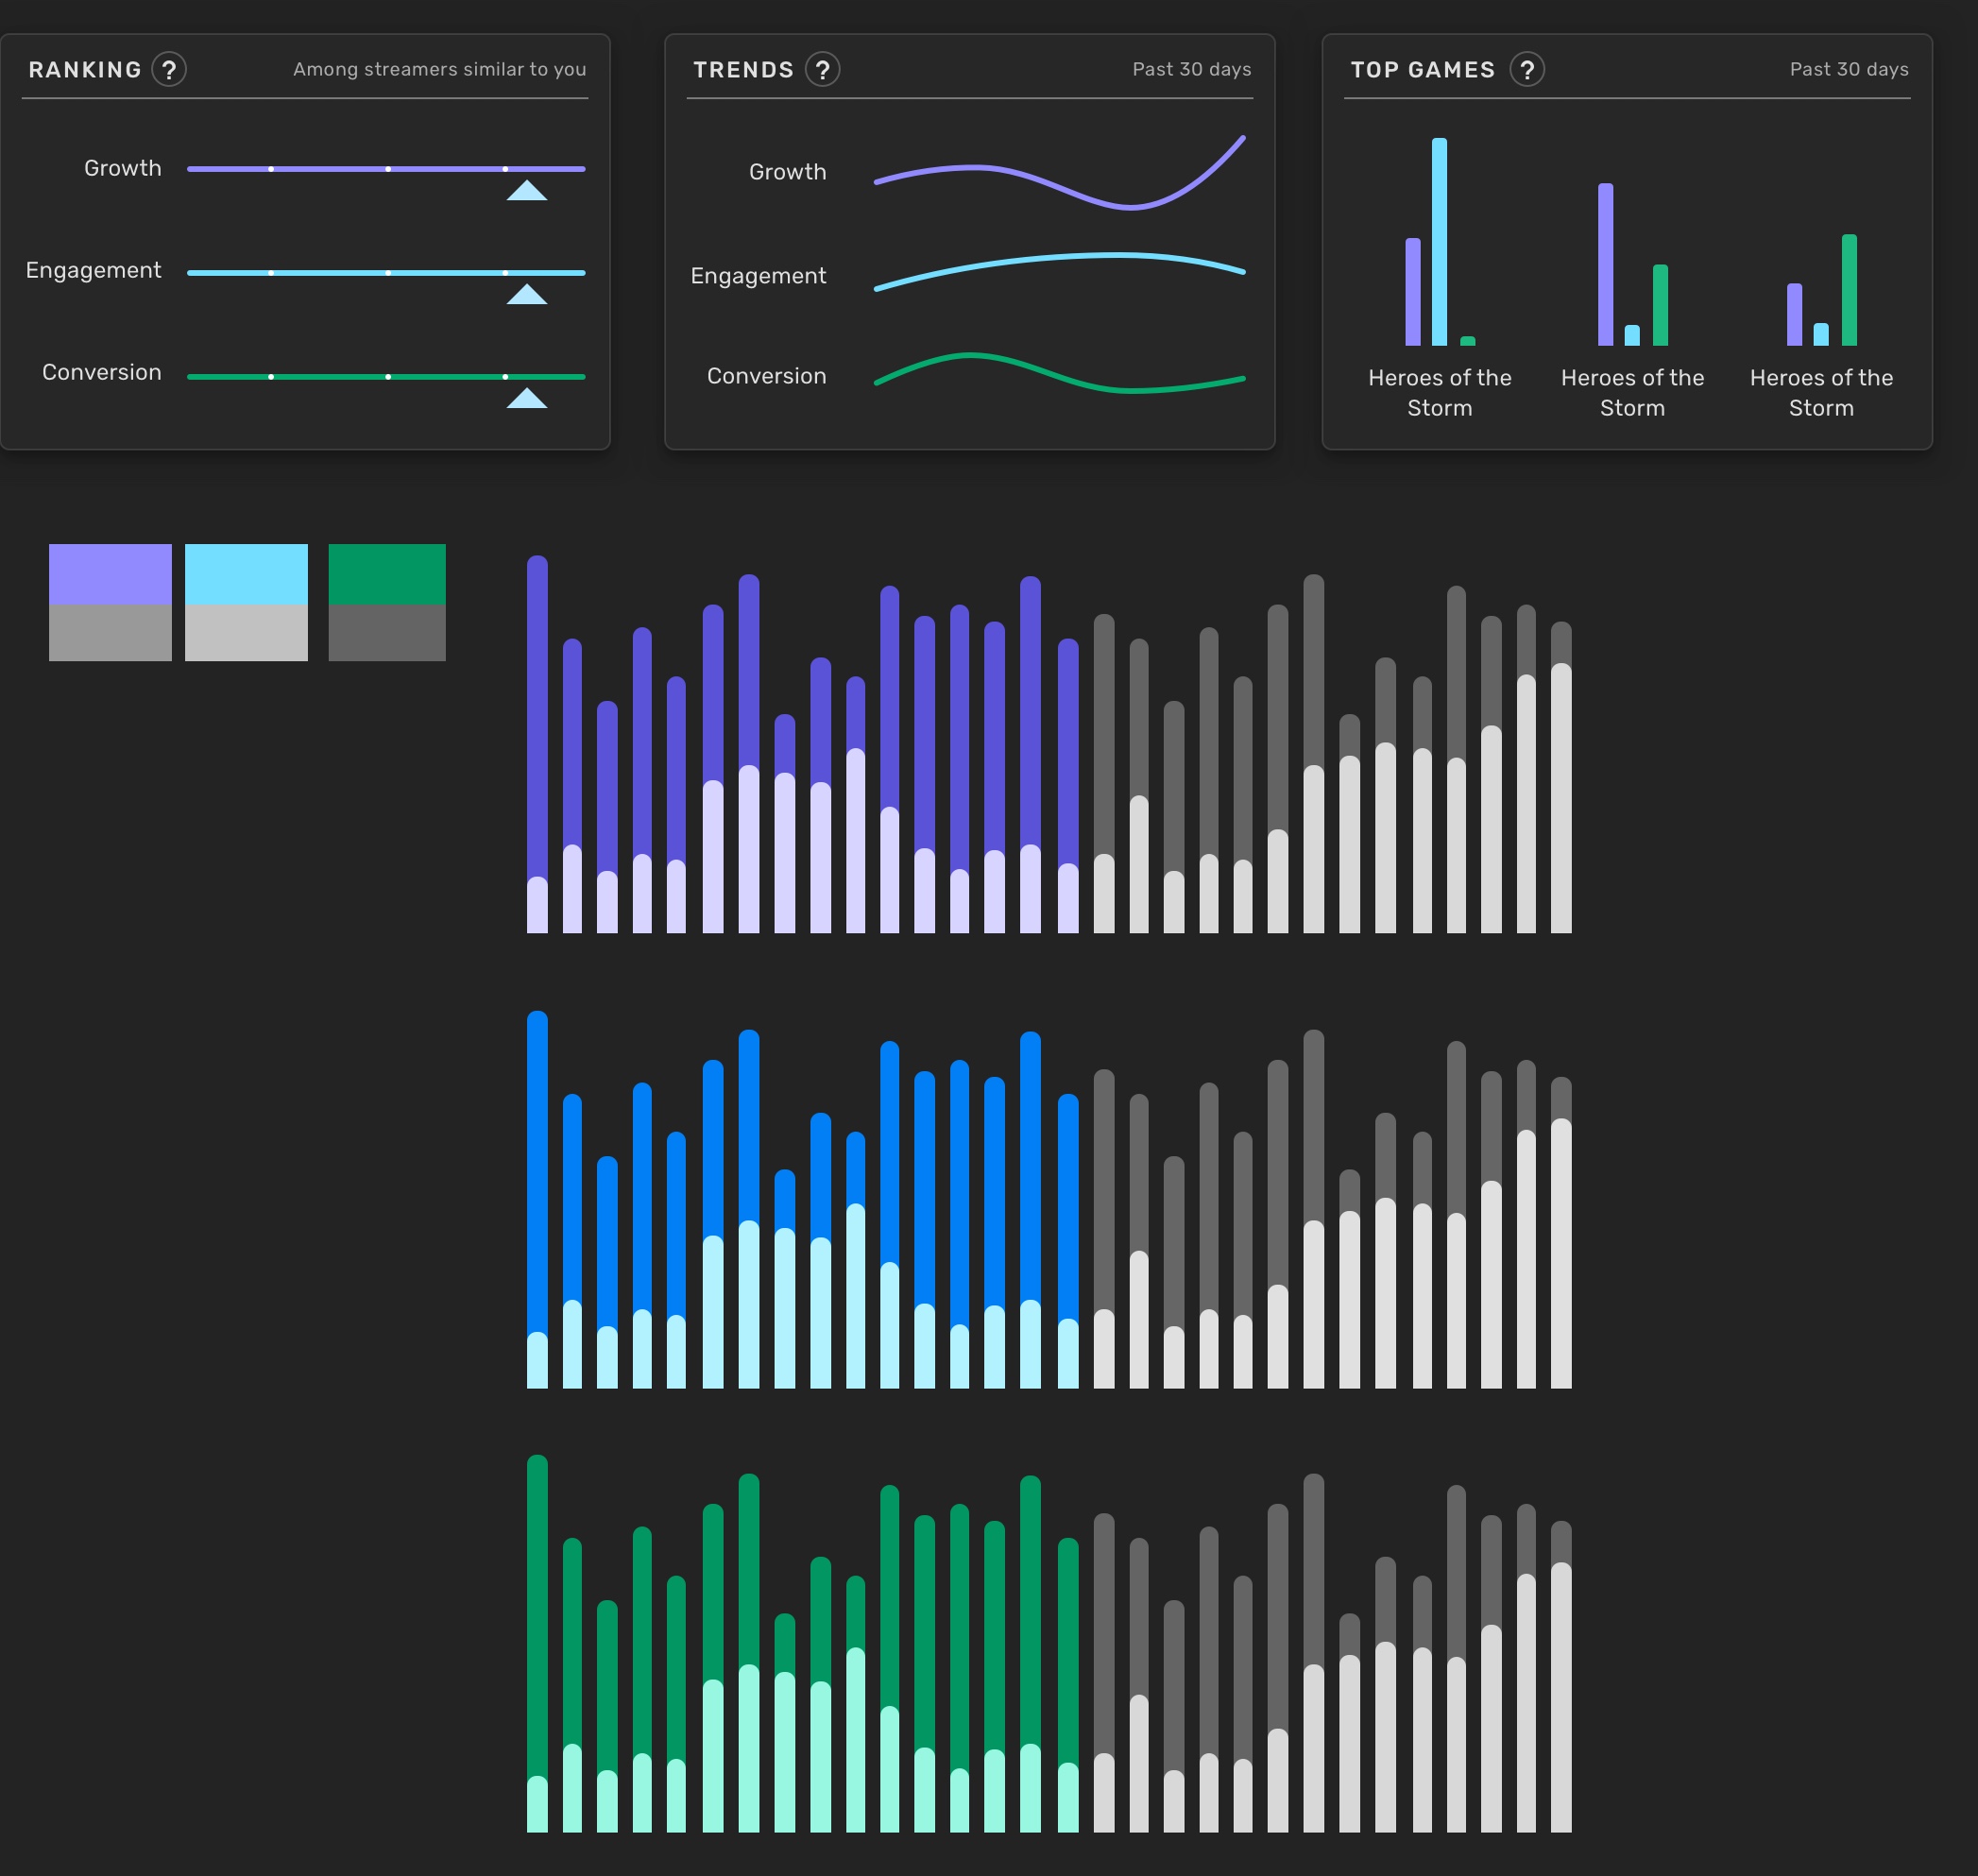
Color tests
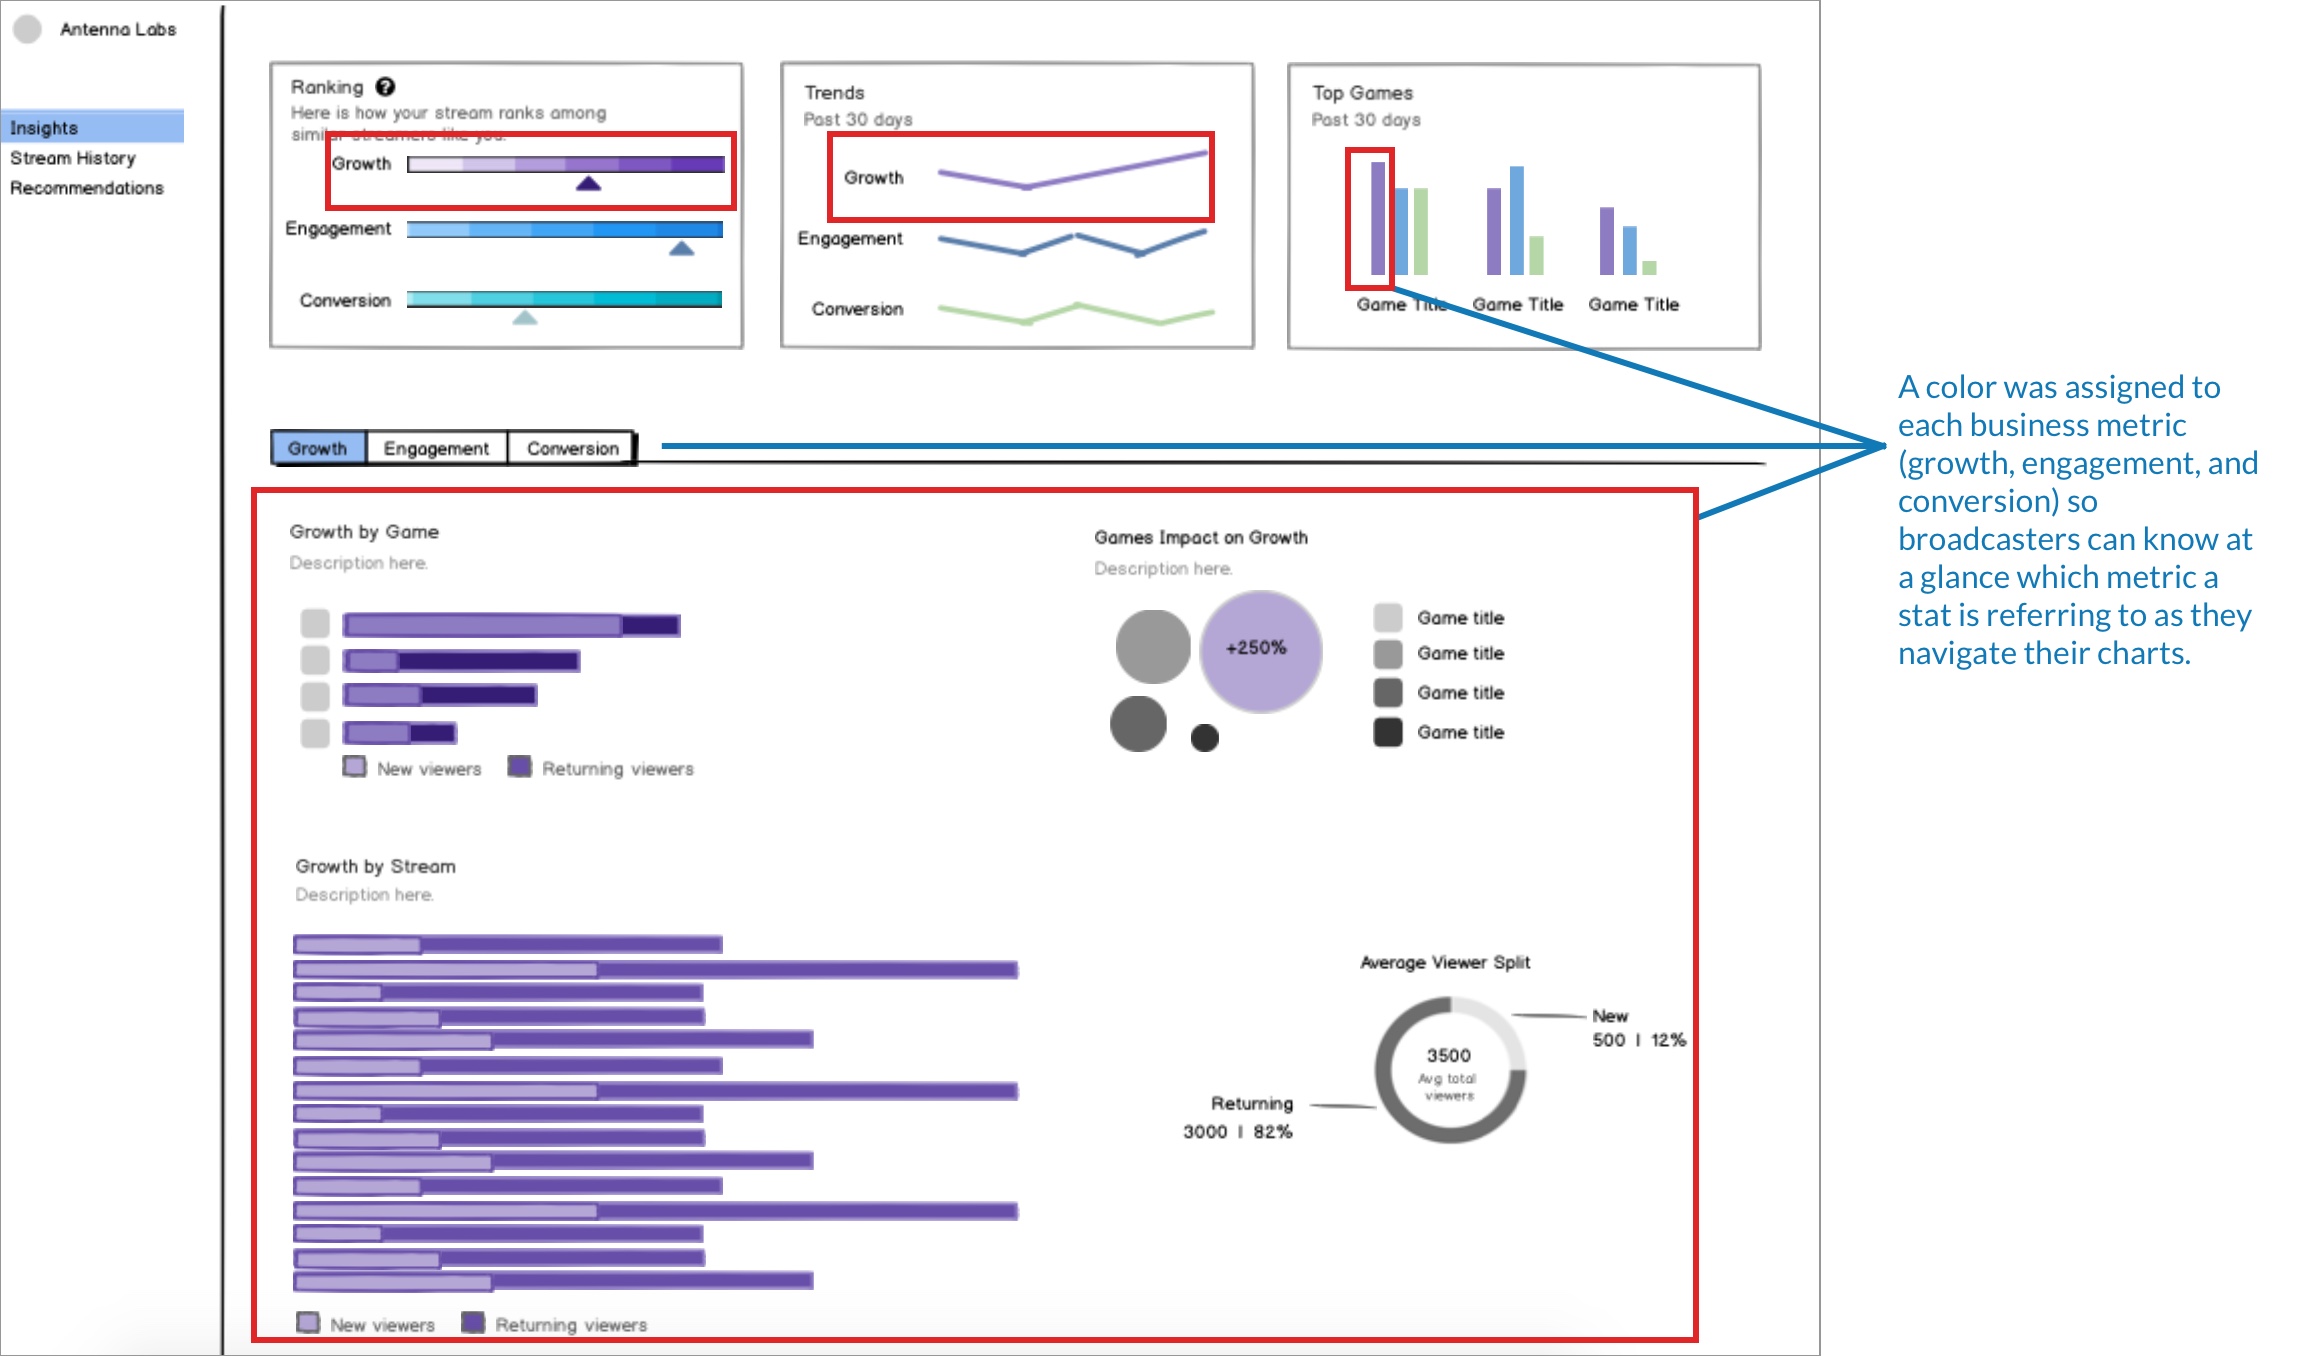
After testing several color combinations, this set became our primary colors for the business metric visualizations. Colors were tested for accessibility and contrast levels to ensure readability.
Visual development in progress
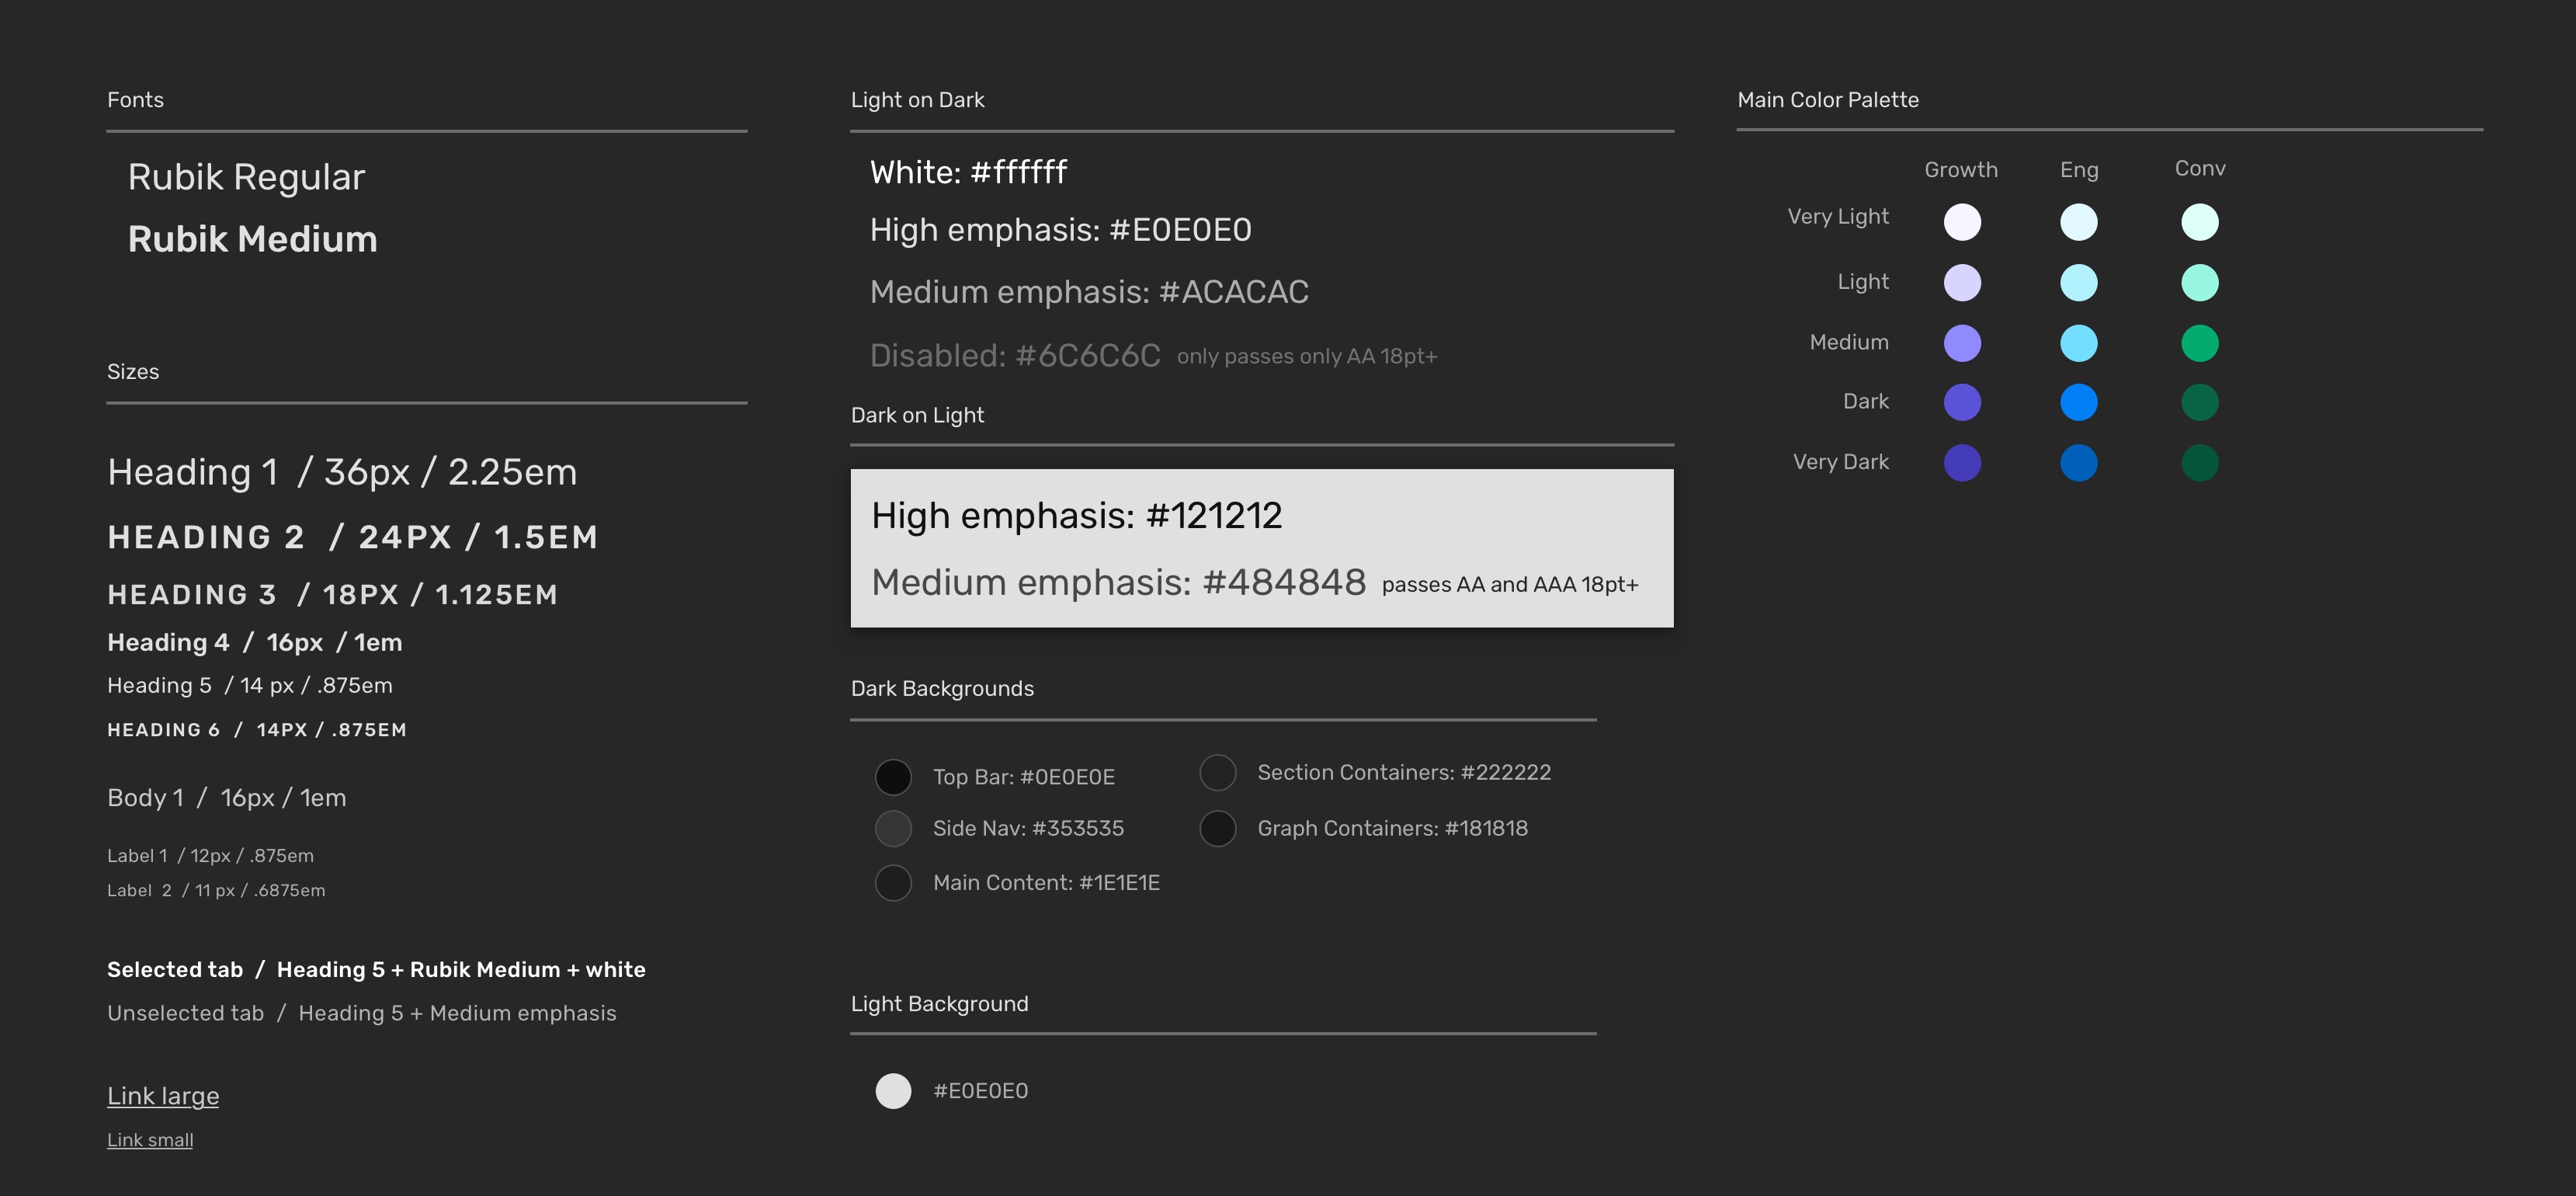
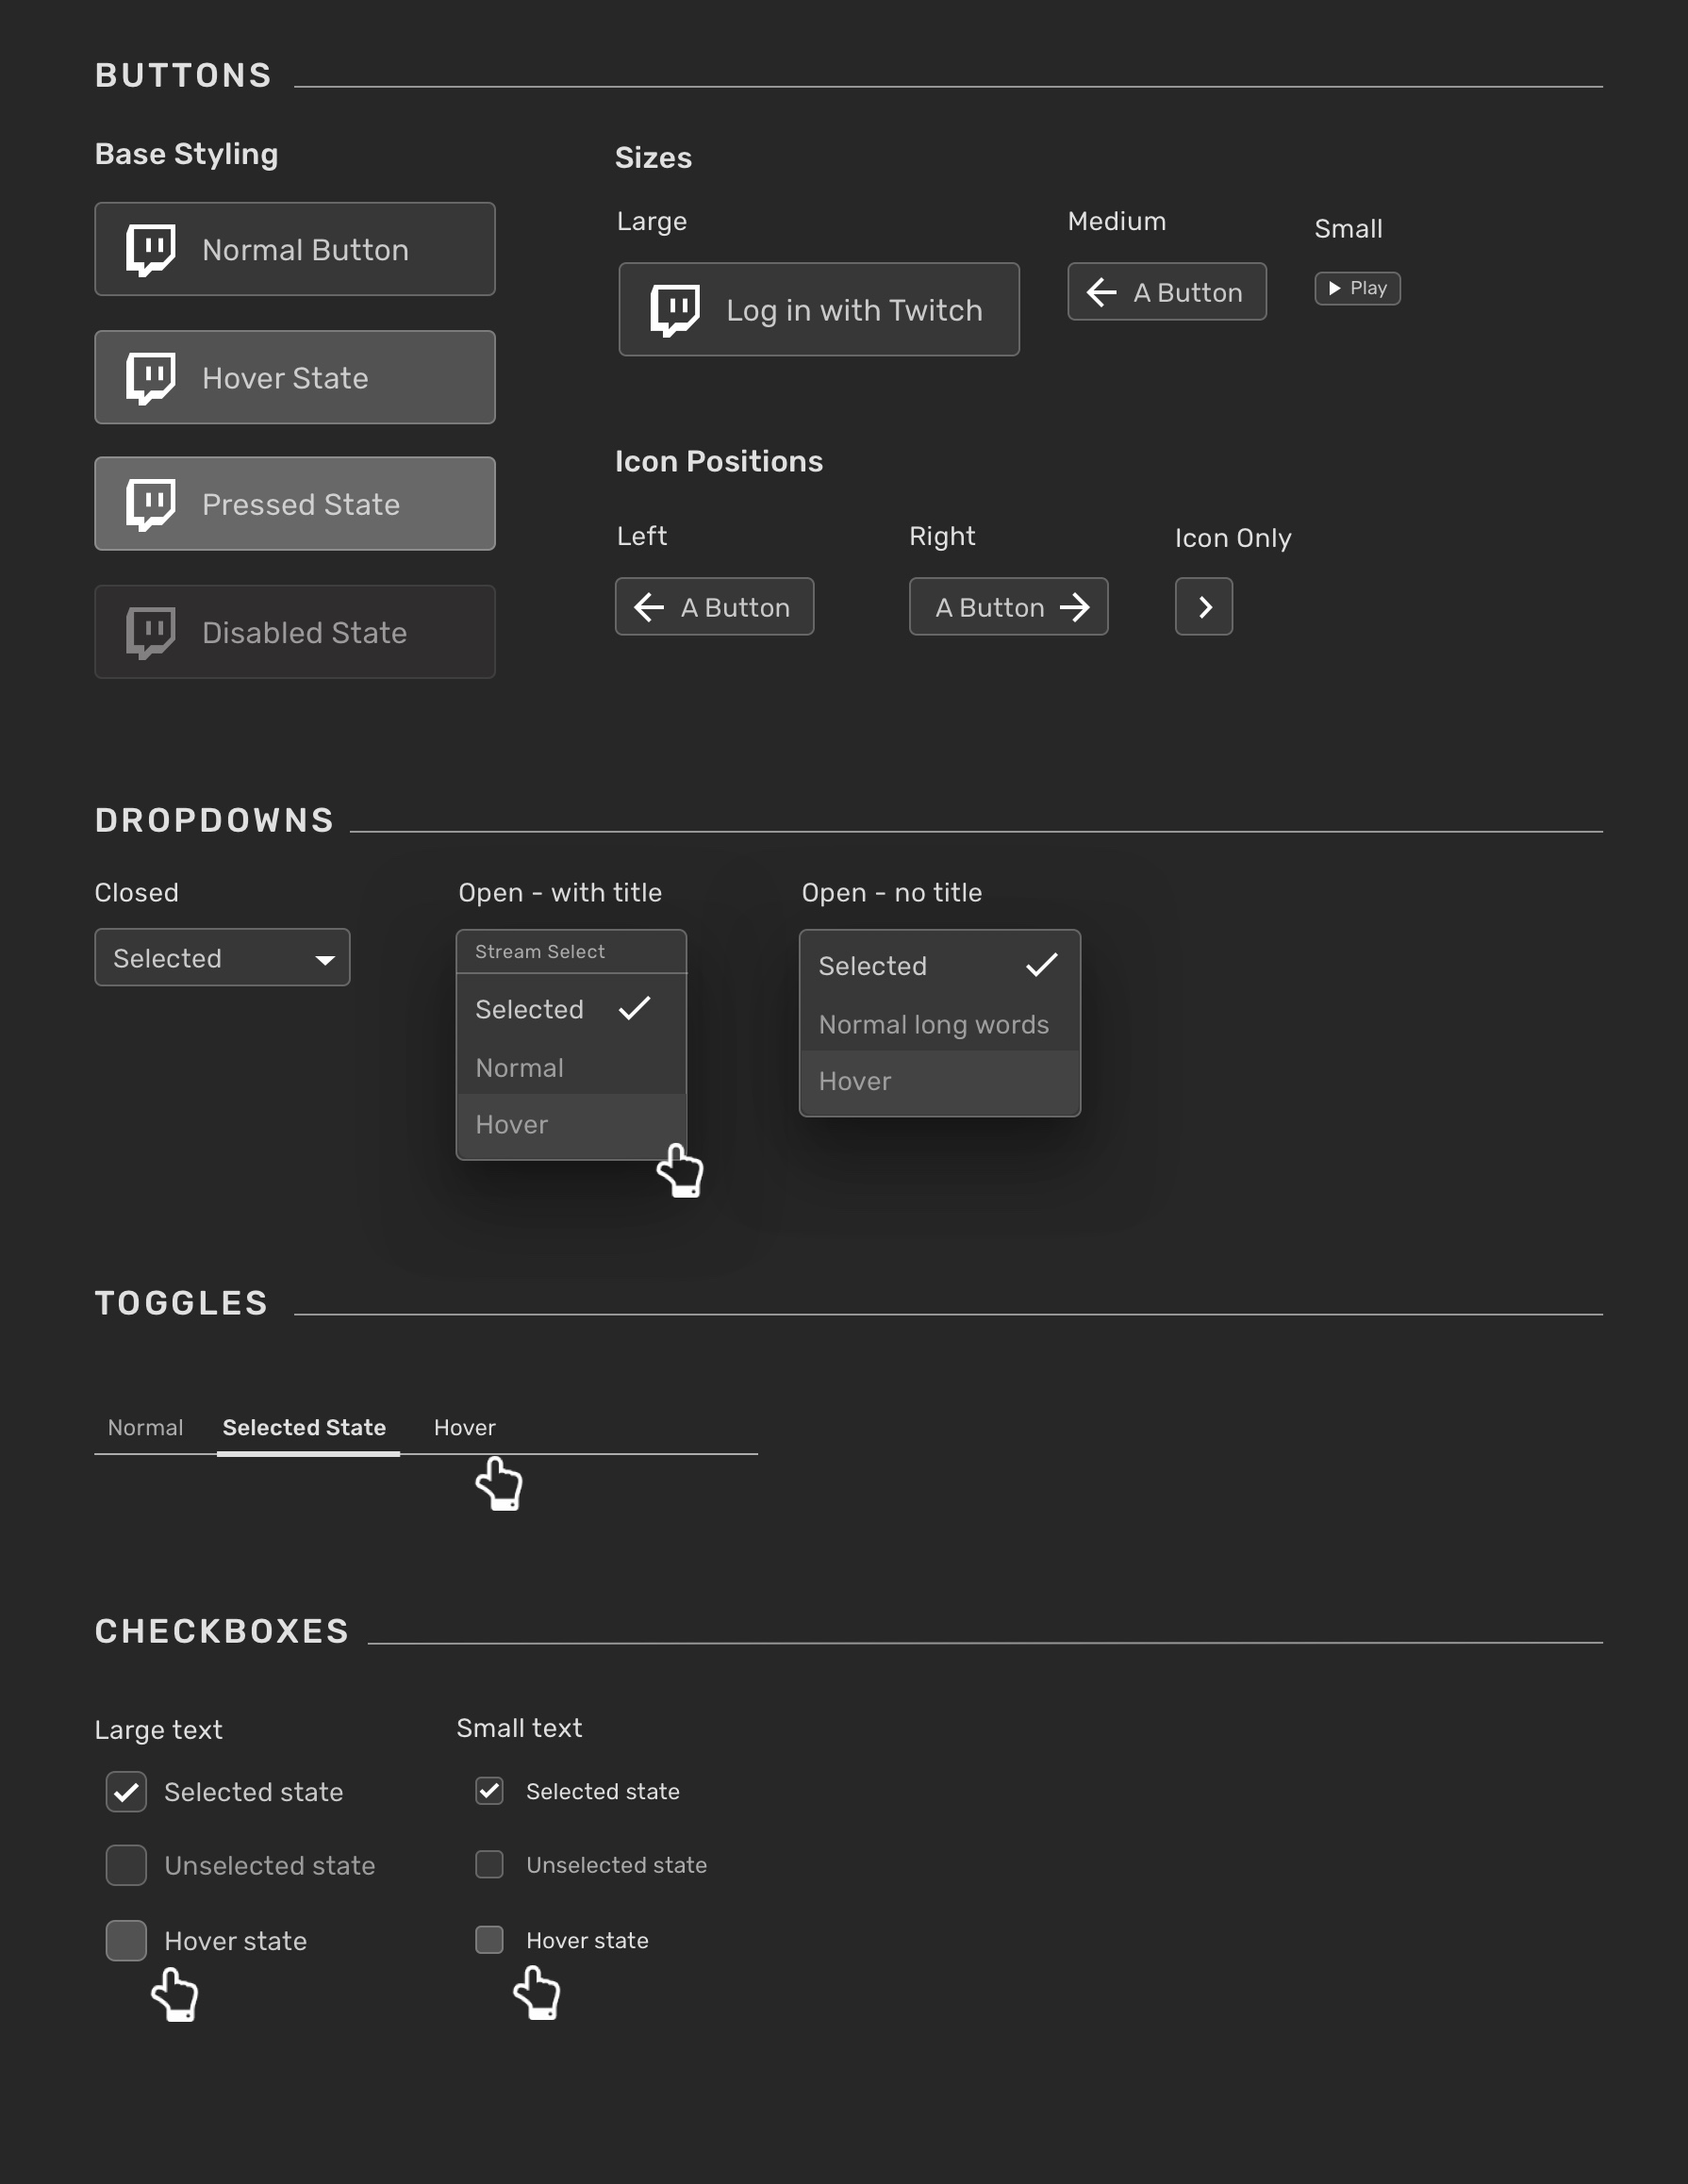
Style definition
Throughout the MVP development, base styles and UI components were defined and set up as resusable styles.
Style library sample
Style library sample
Insights MVP
The Insights dashboard launched as our MVP in August 2019. We built this in about 1 1/2 months.
Post-Launch Feature Development
Shortly after launch, we added 2 new features that didn't make it in time for the MVP, but that we had hypothesized would be valuable based on our user research.
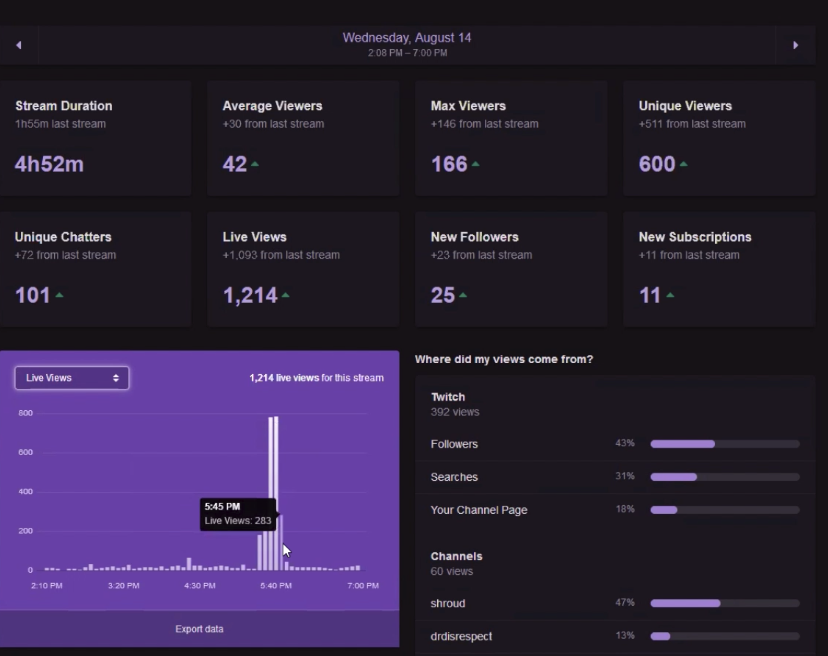
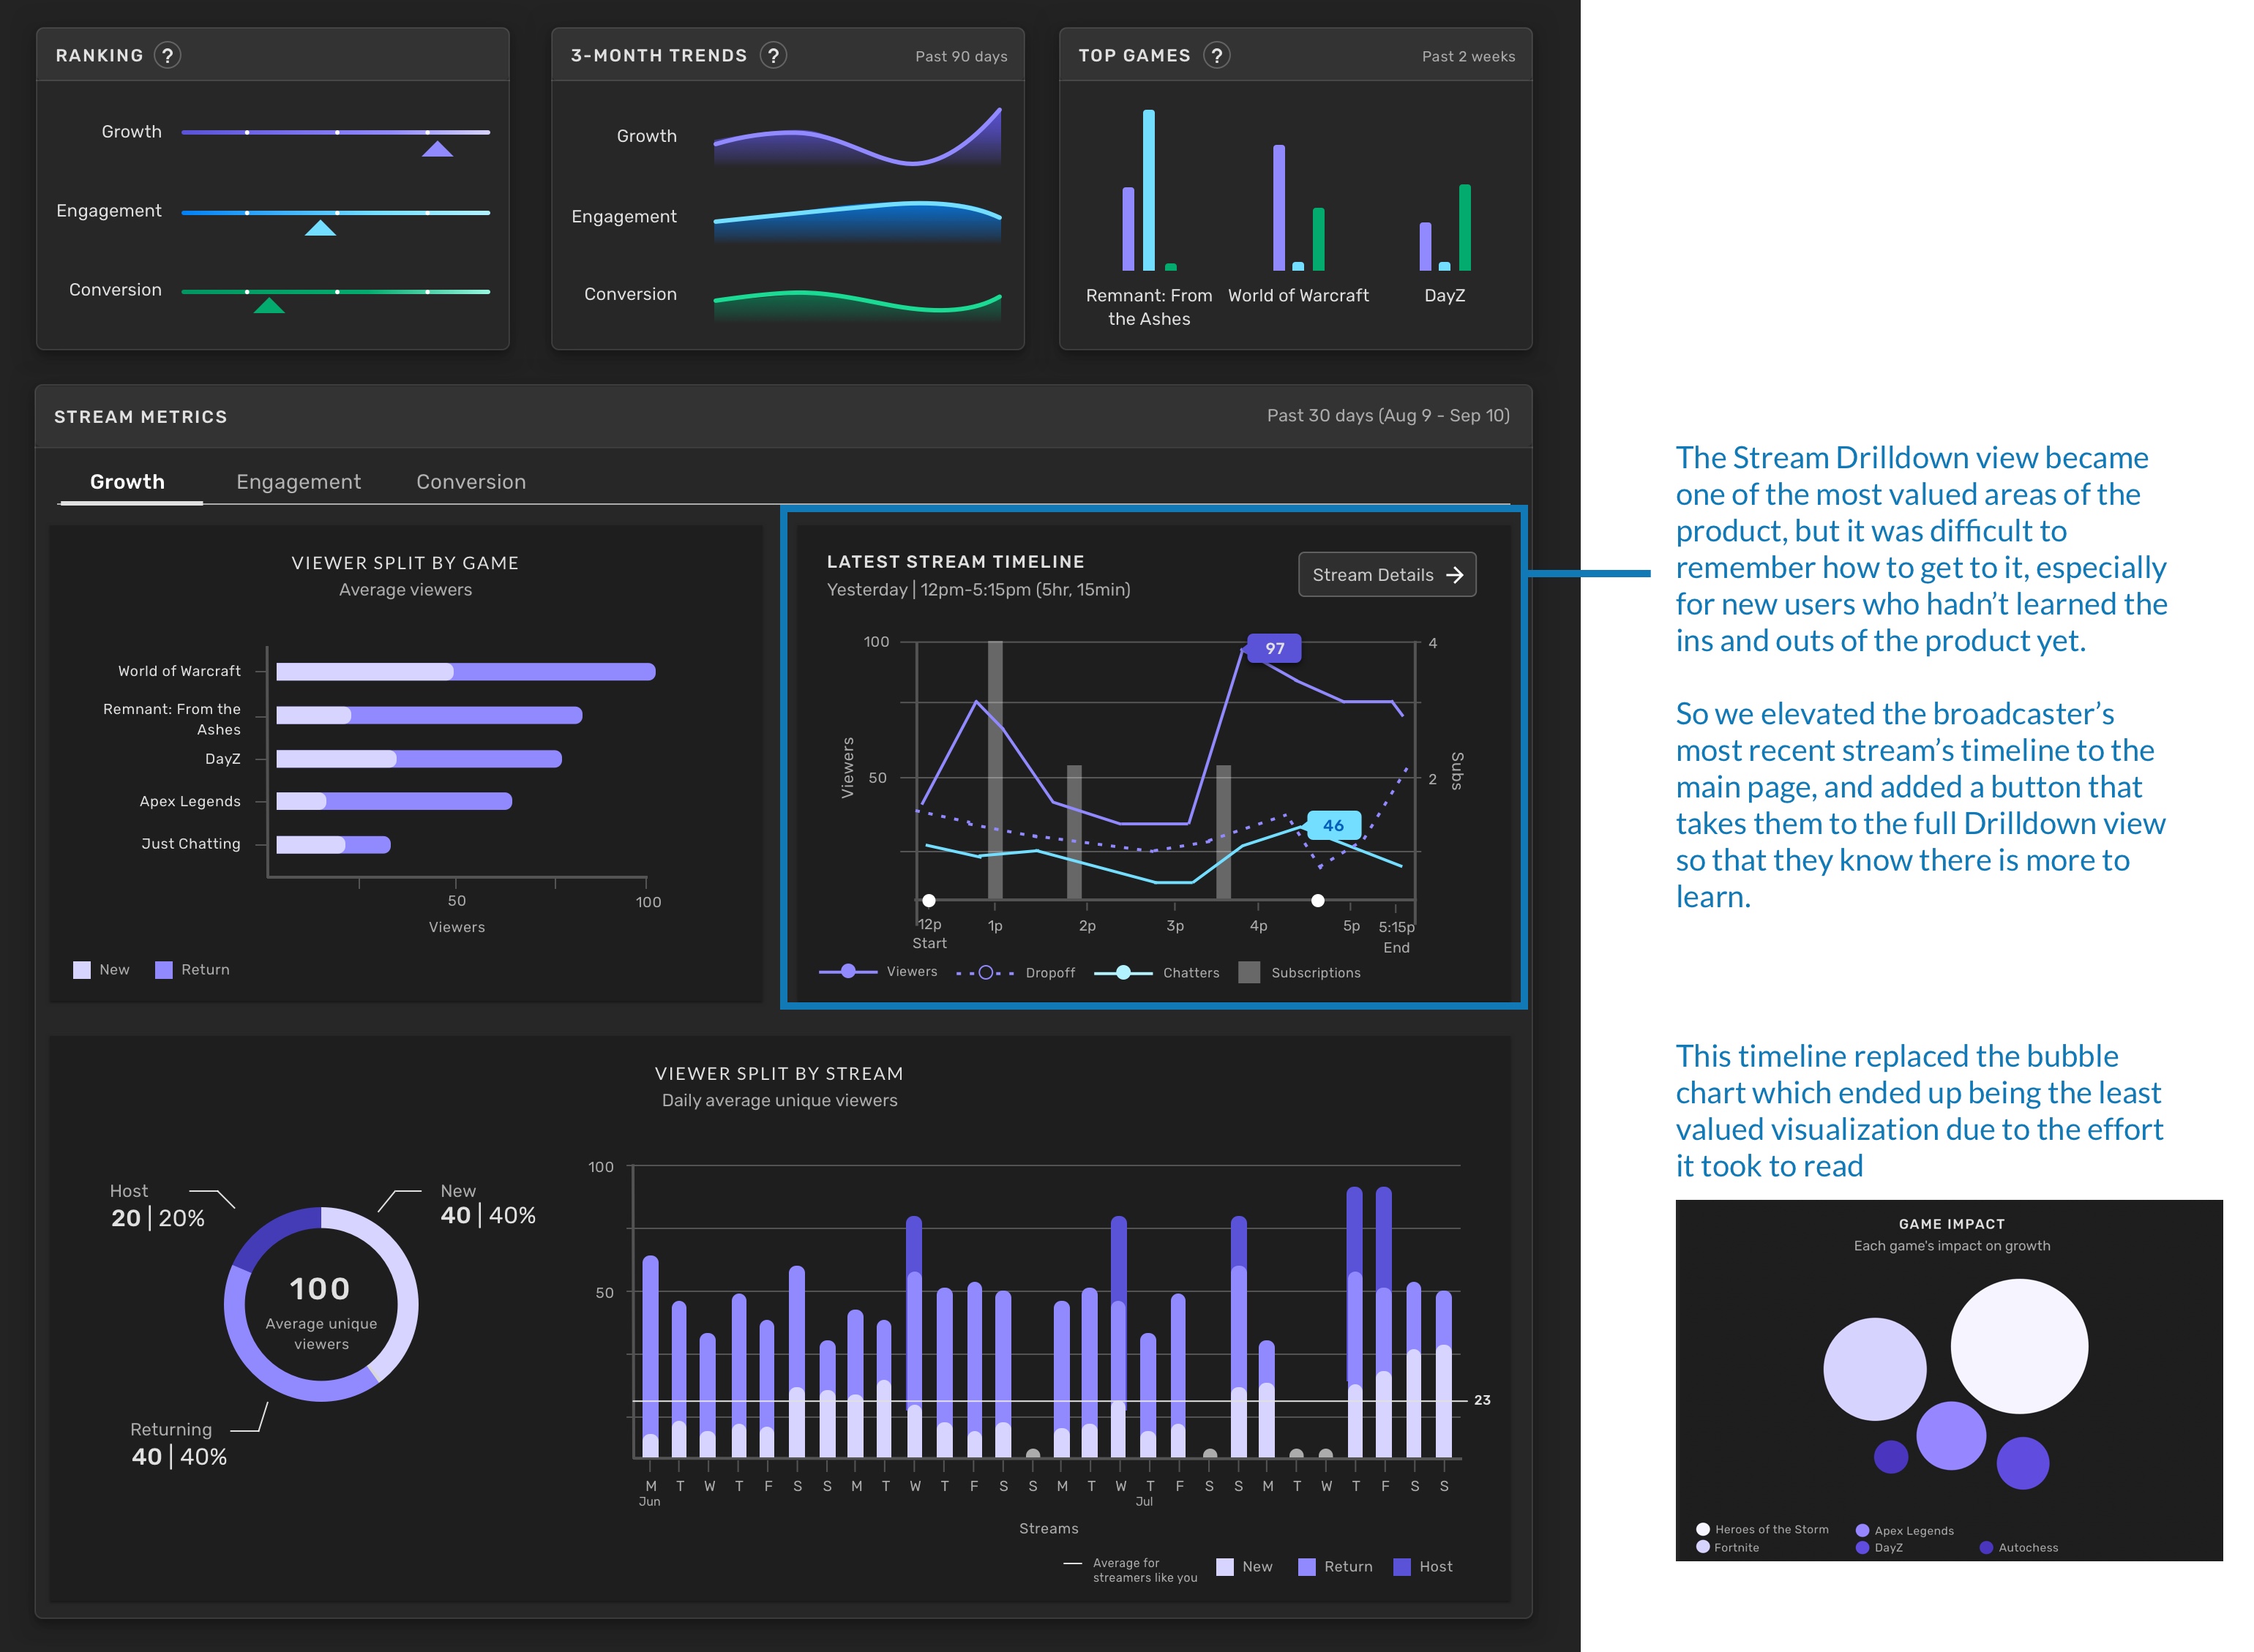
Stream Timeline
A timeline view from start to end of each individual stream.
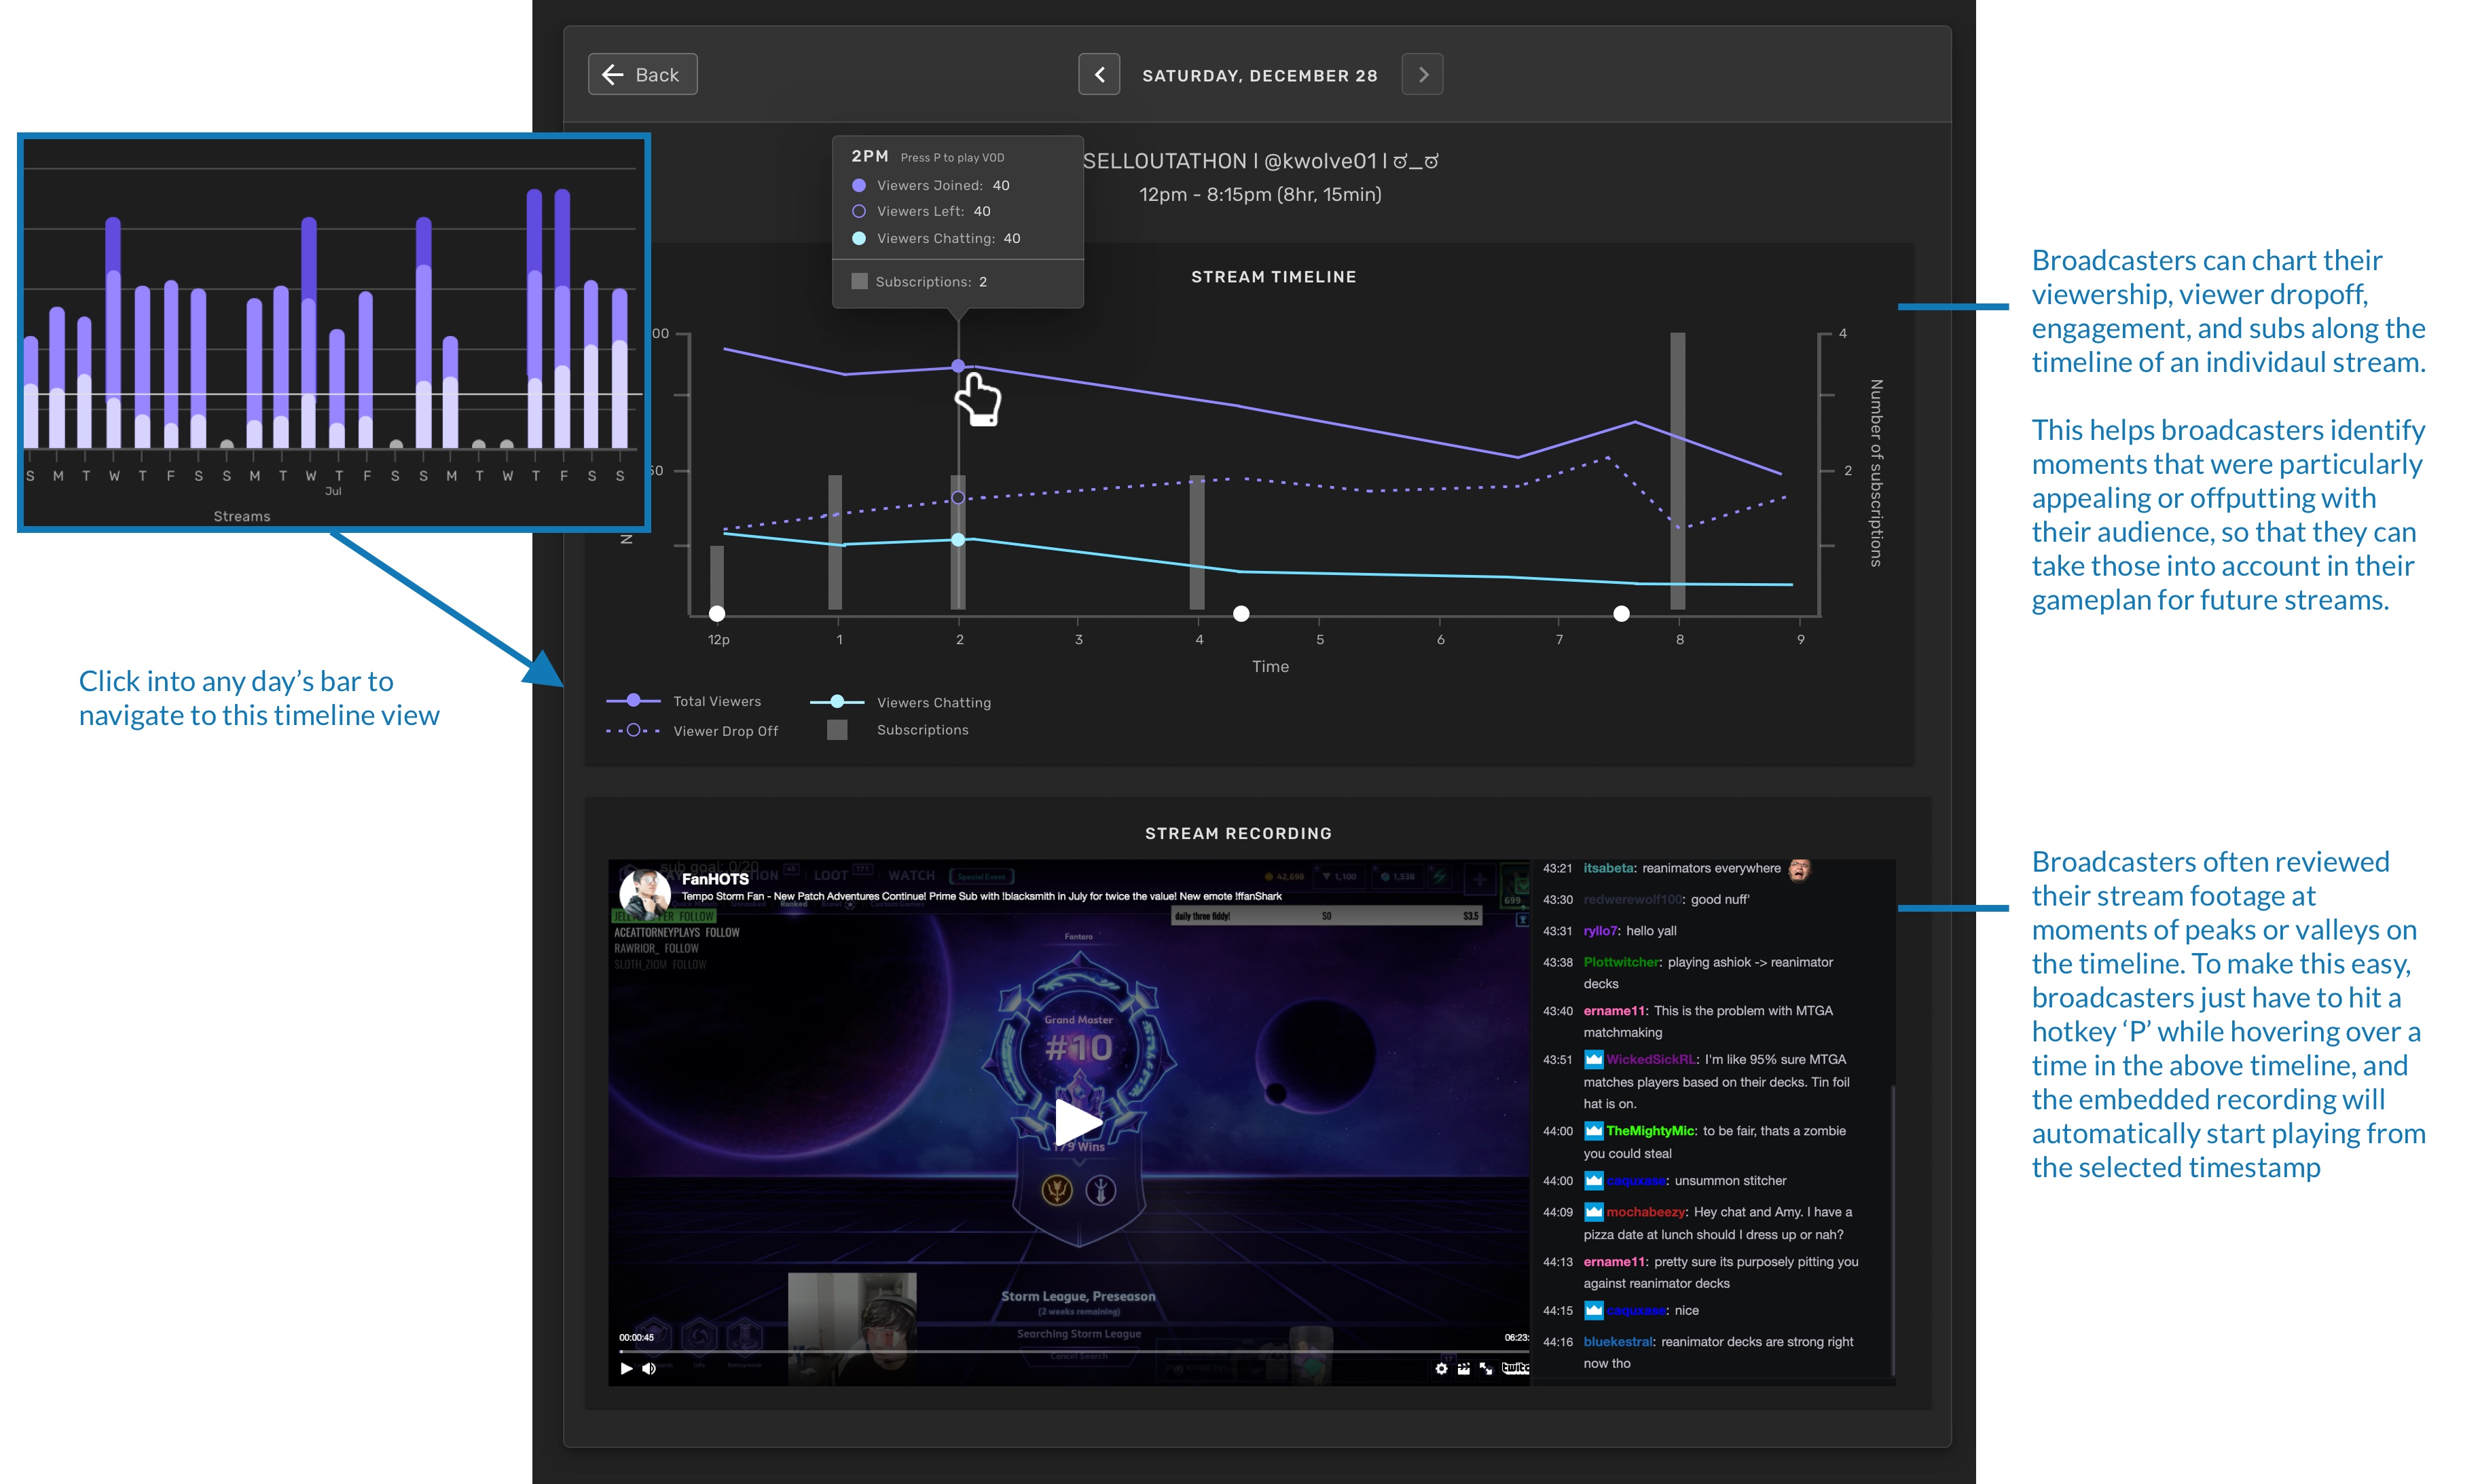
This feature excited broadcasters from the get-go, such that they kept asking for more data about their streams. So shortly thereafter, we enhanced this view with even more detail (and rechristened it the "Stream Drilldown" view since it was no longer only about a timeline).
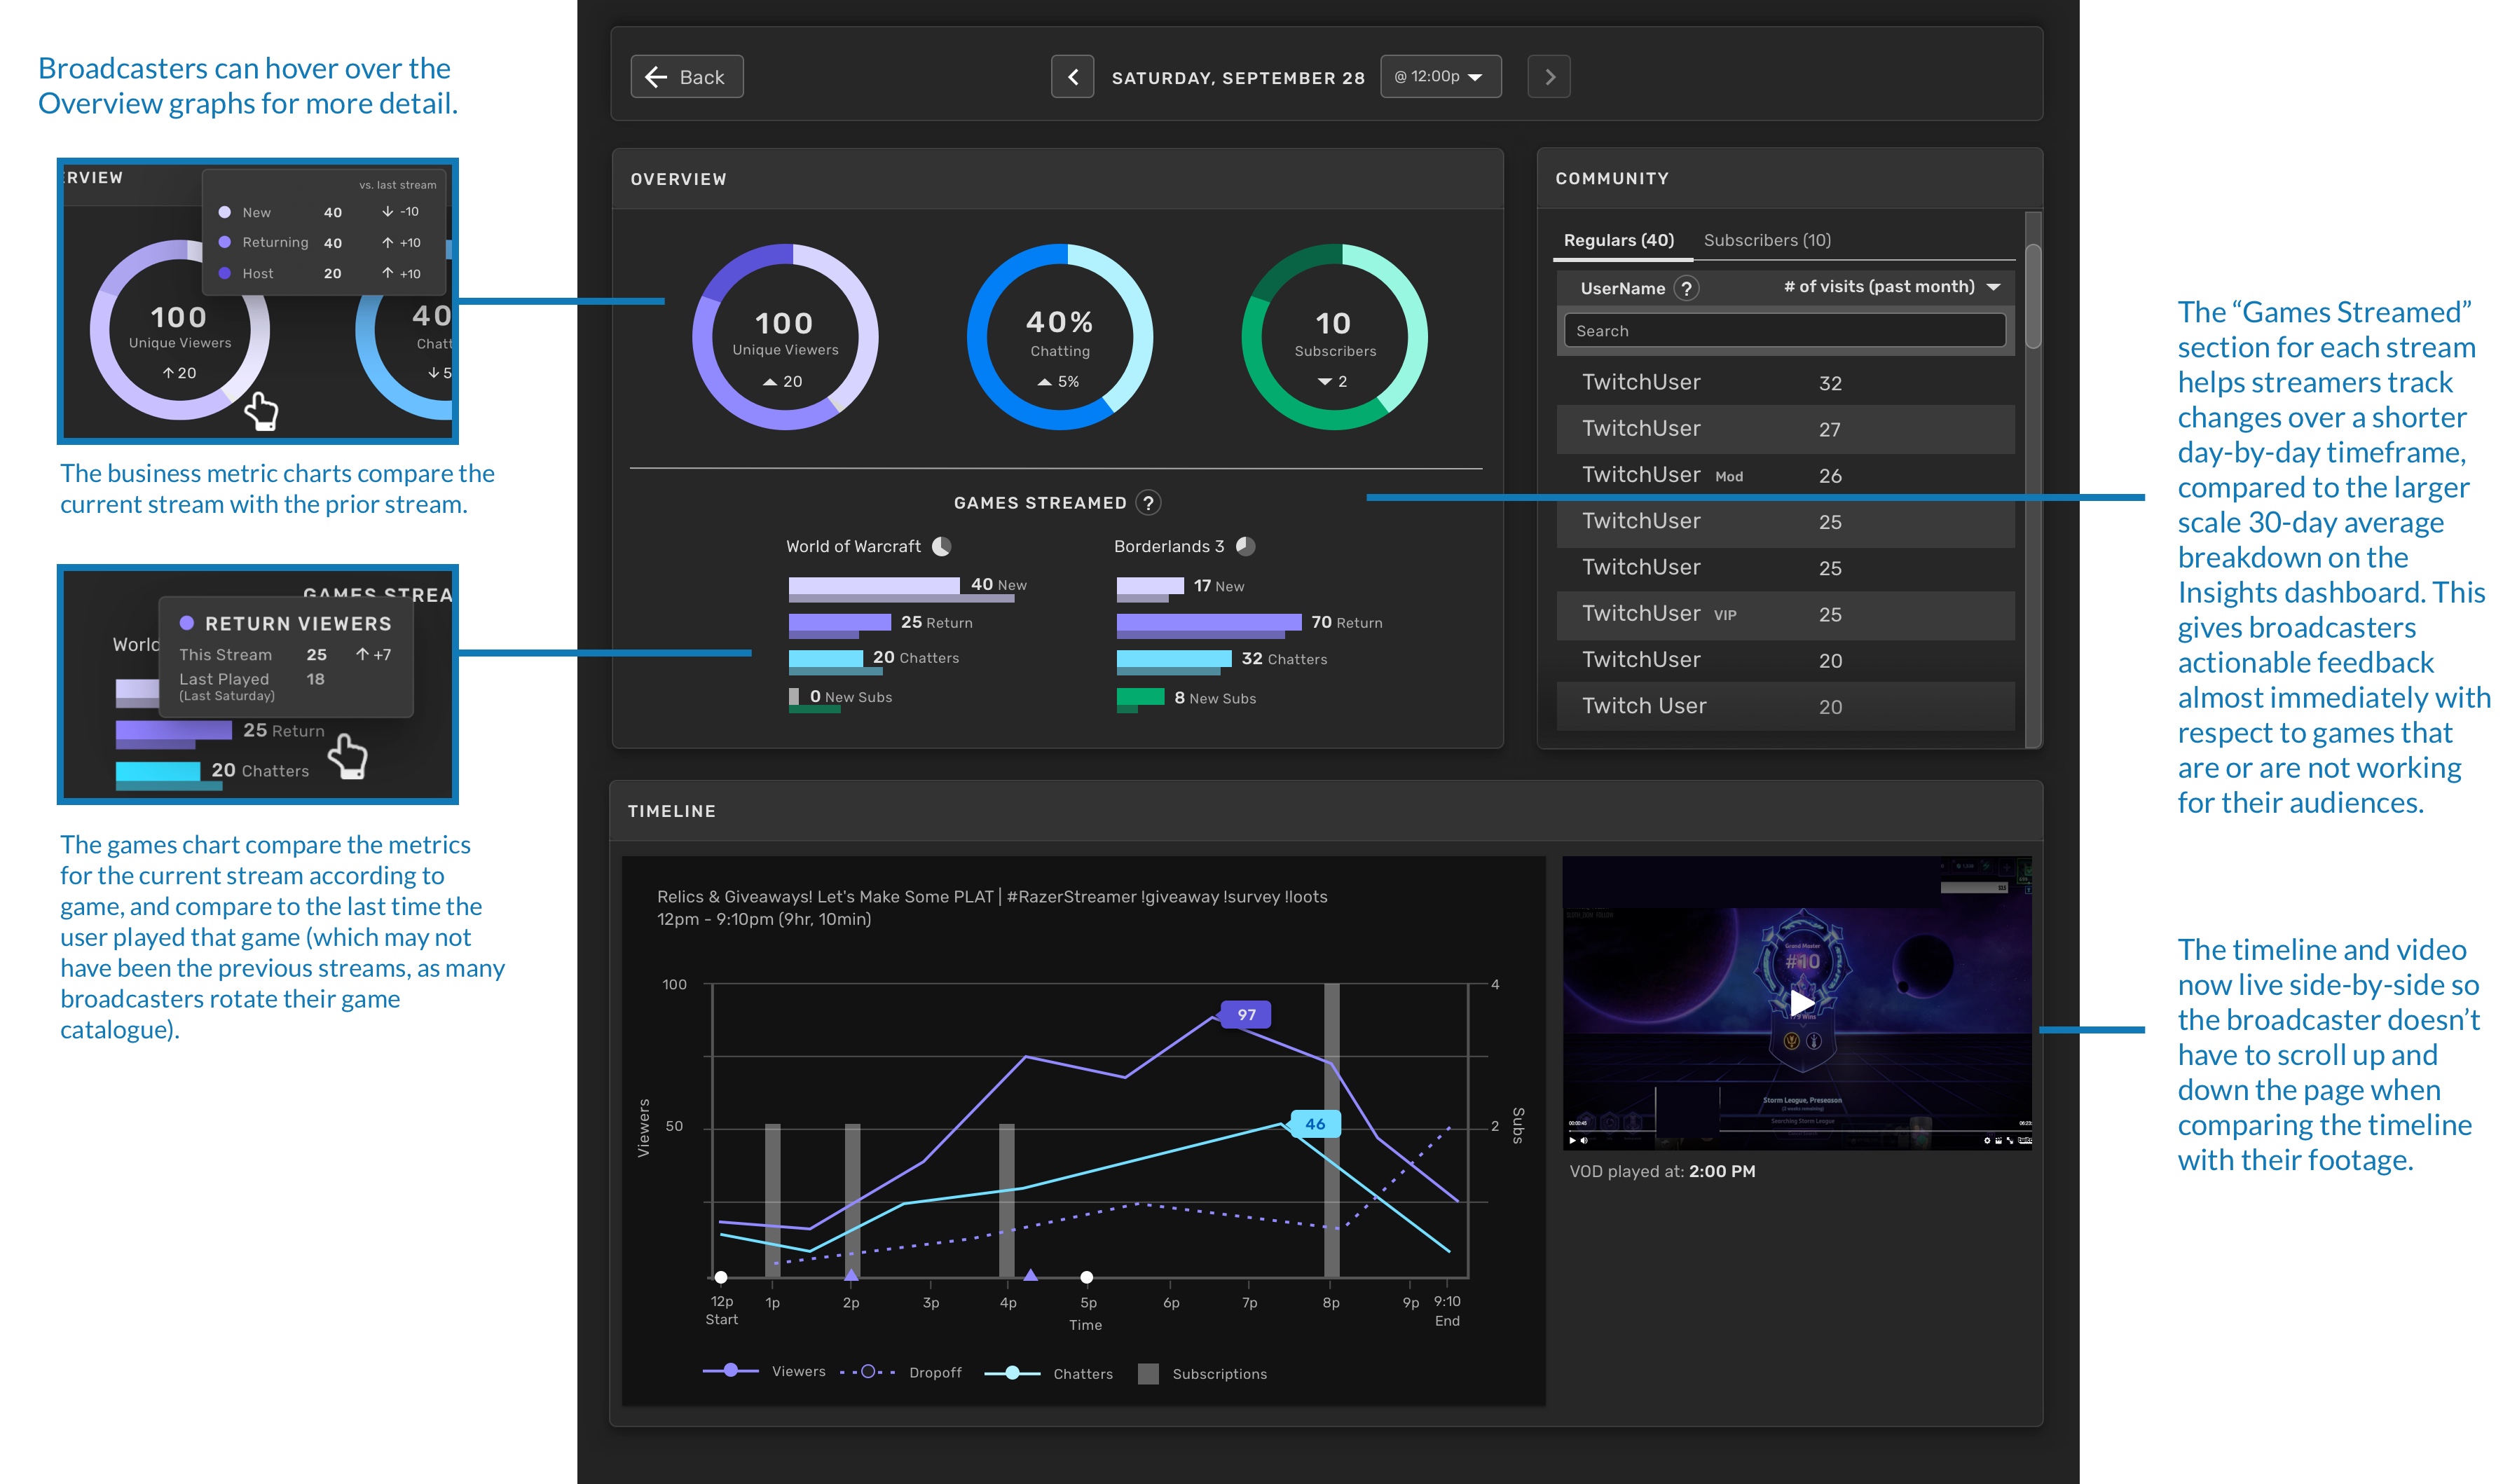
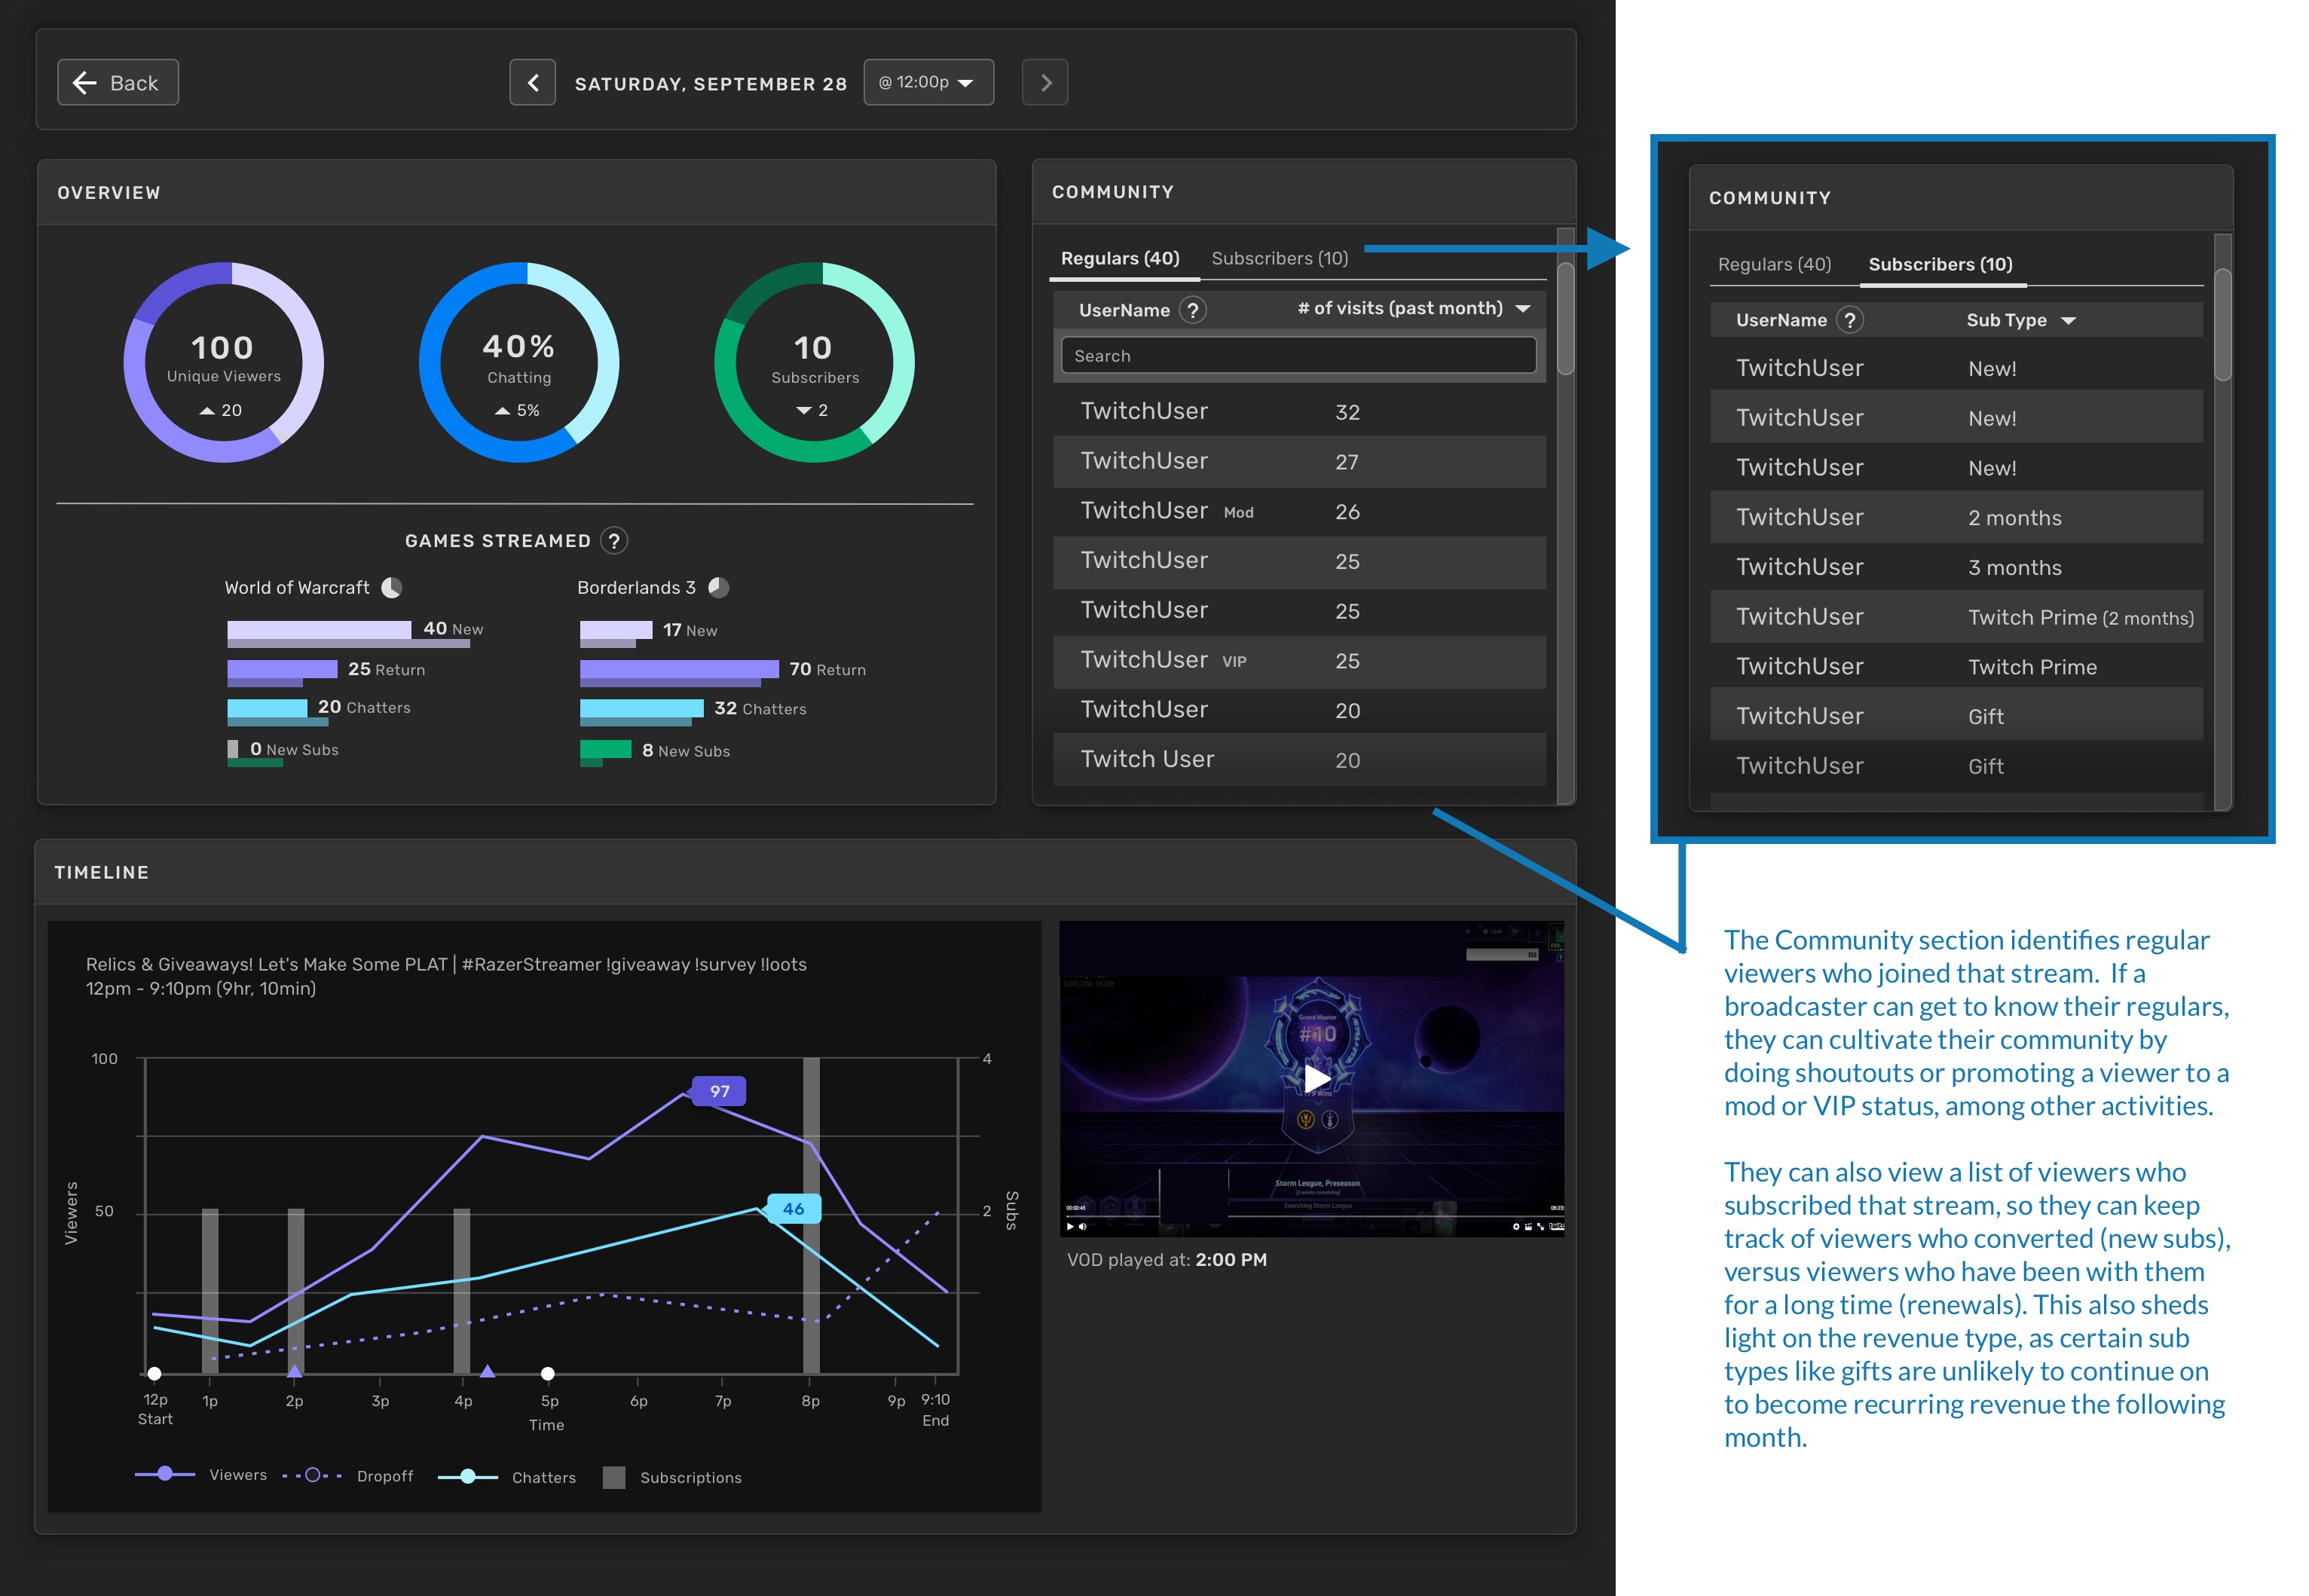
This view quickly became one of the highest valued areas in our product, but it was difficult for users to remember how to get to, so we elevated a portion of it to the main dashboard.
Game Recommendations
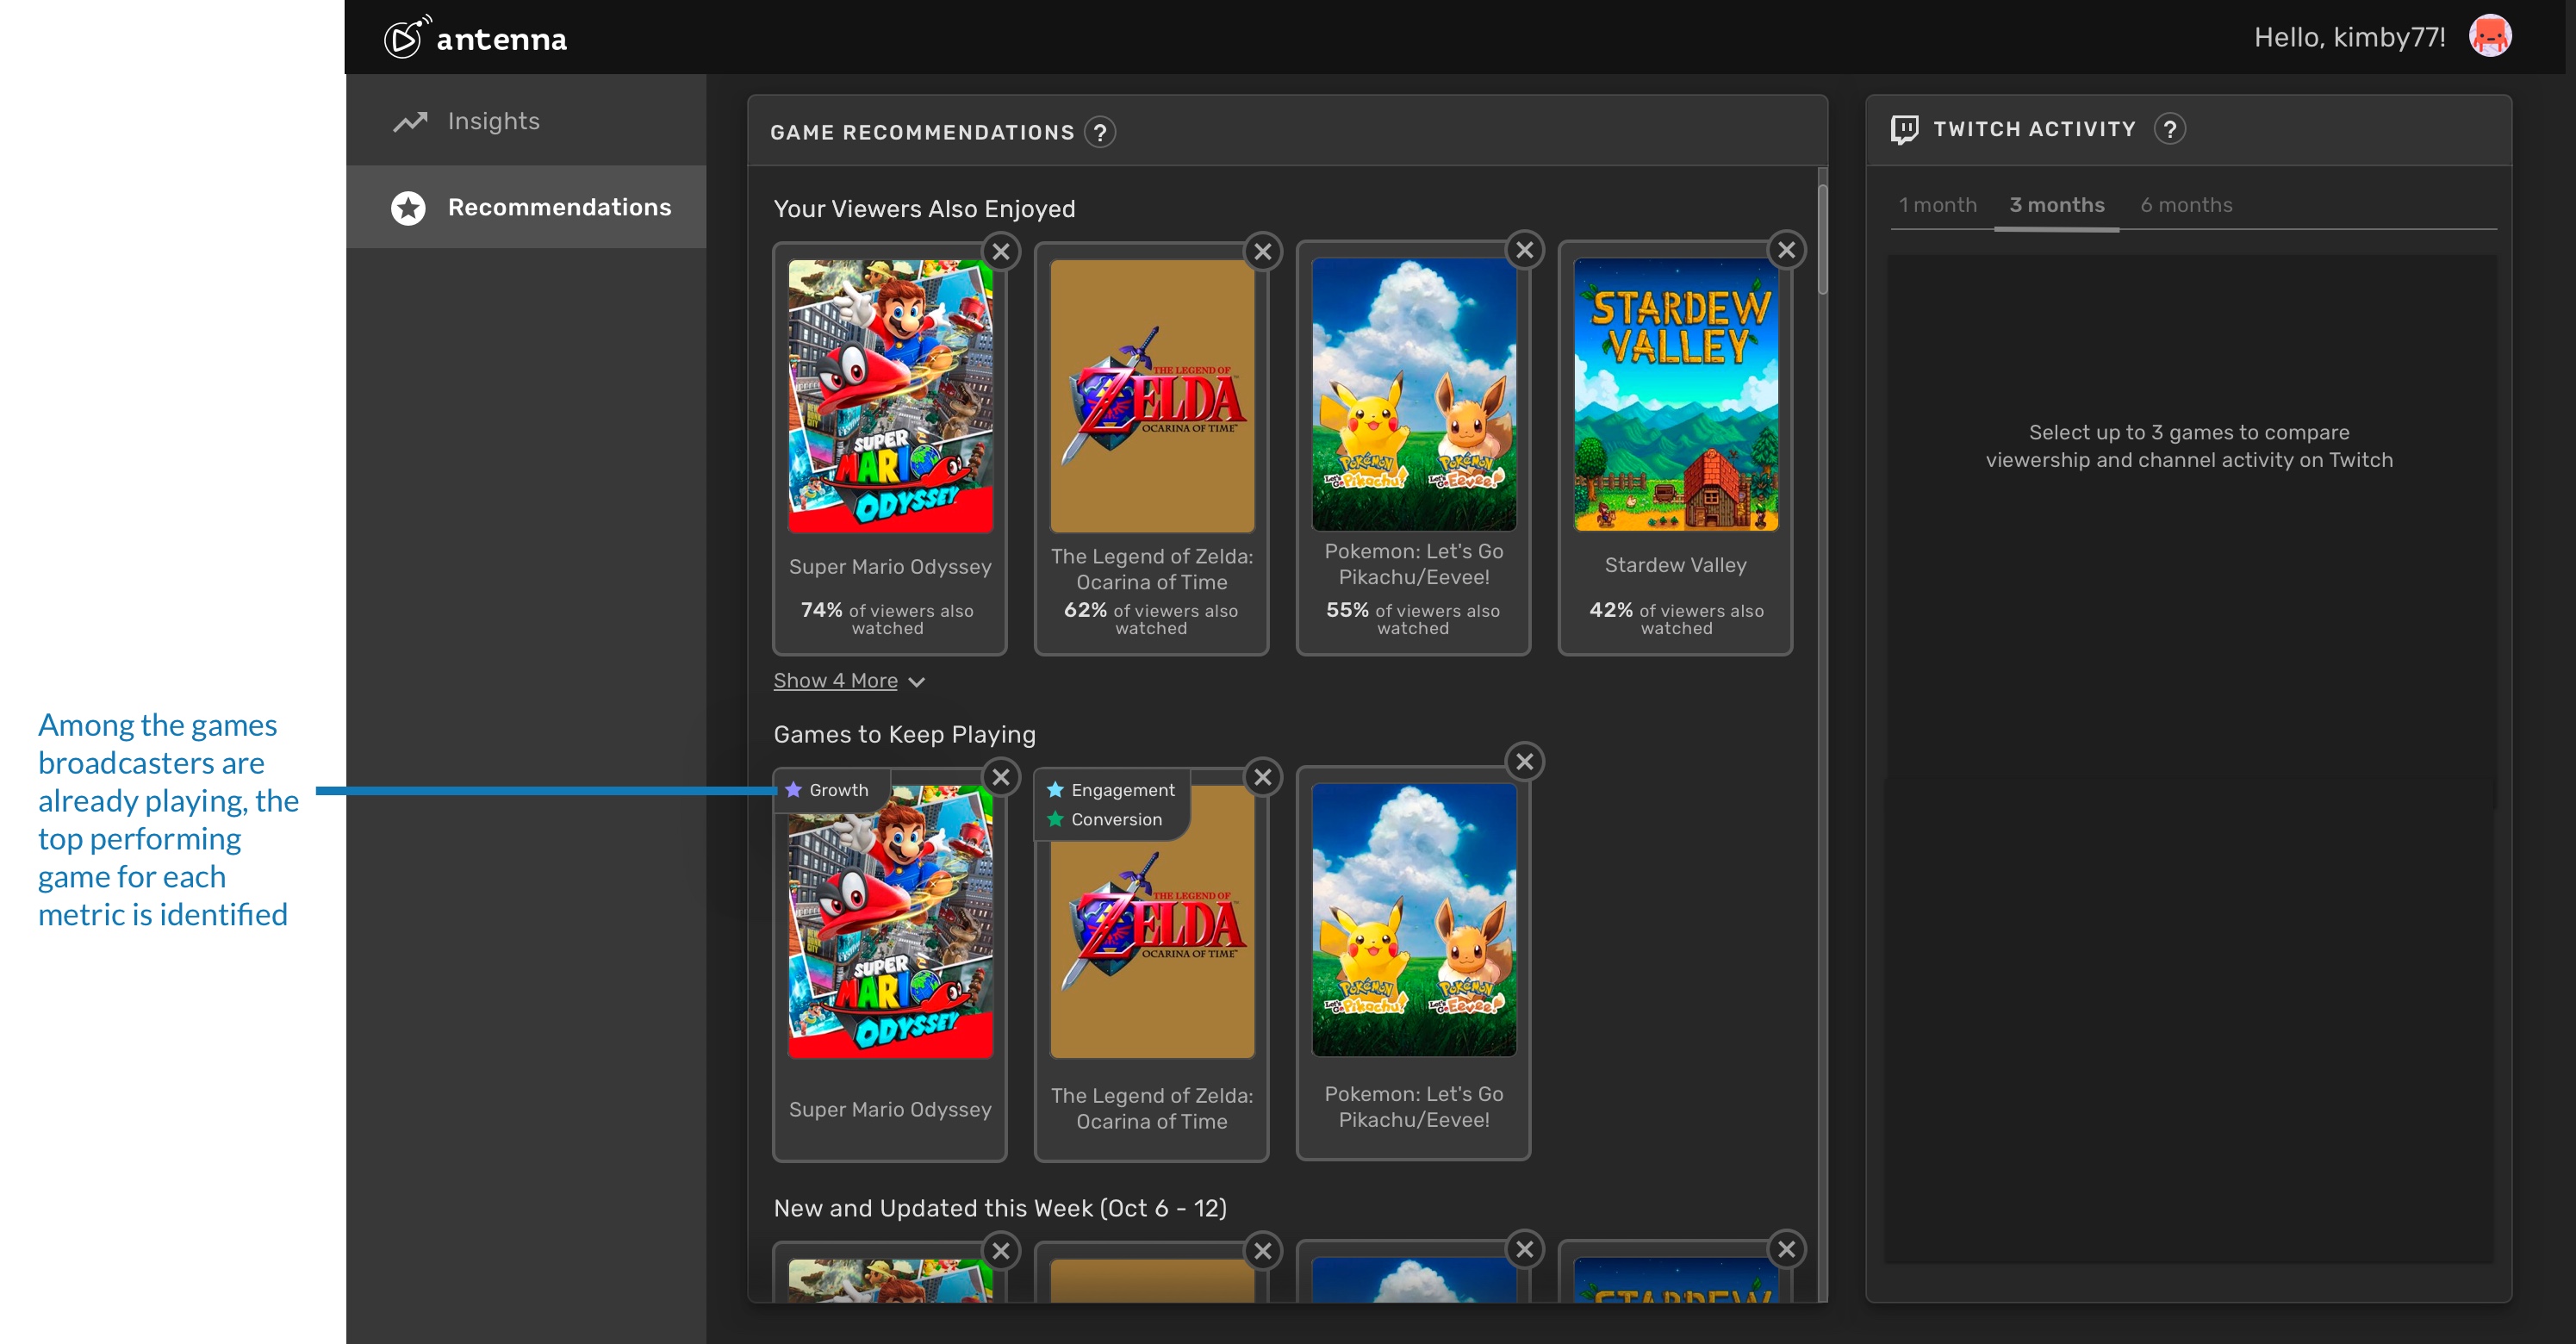
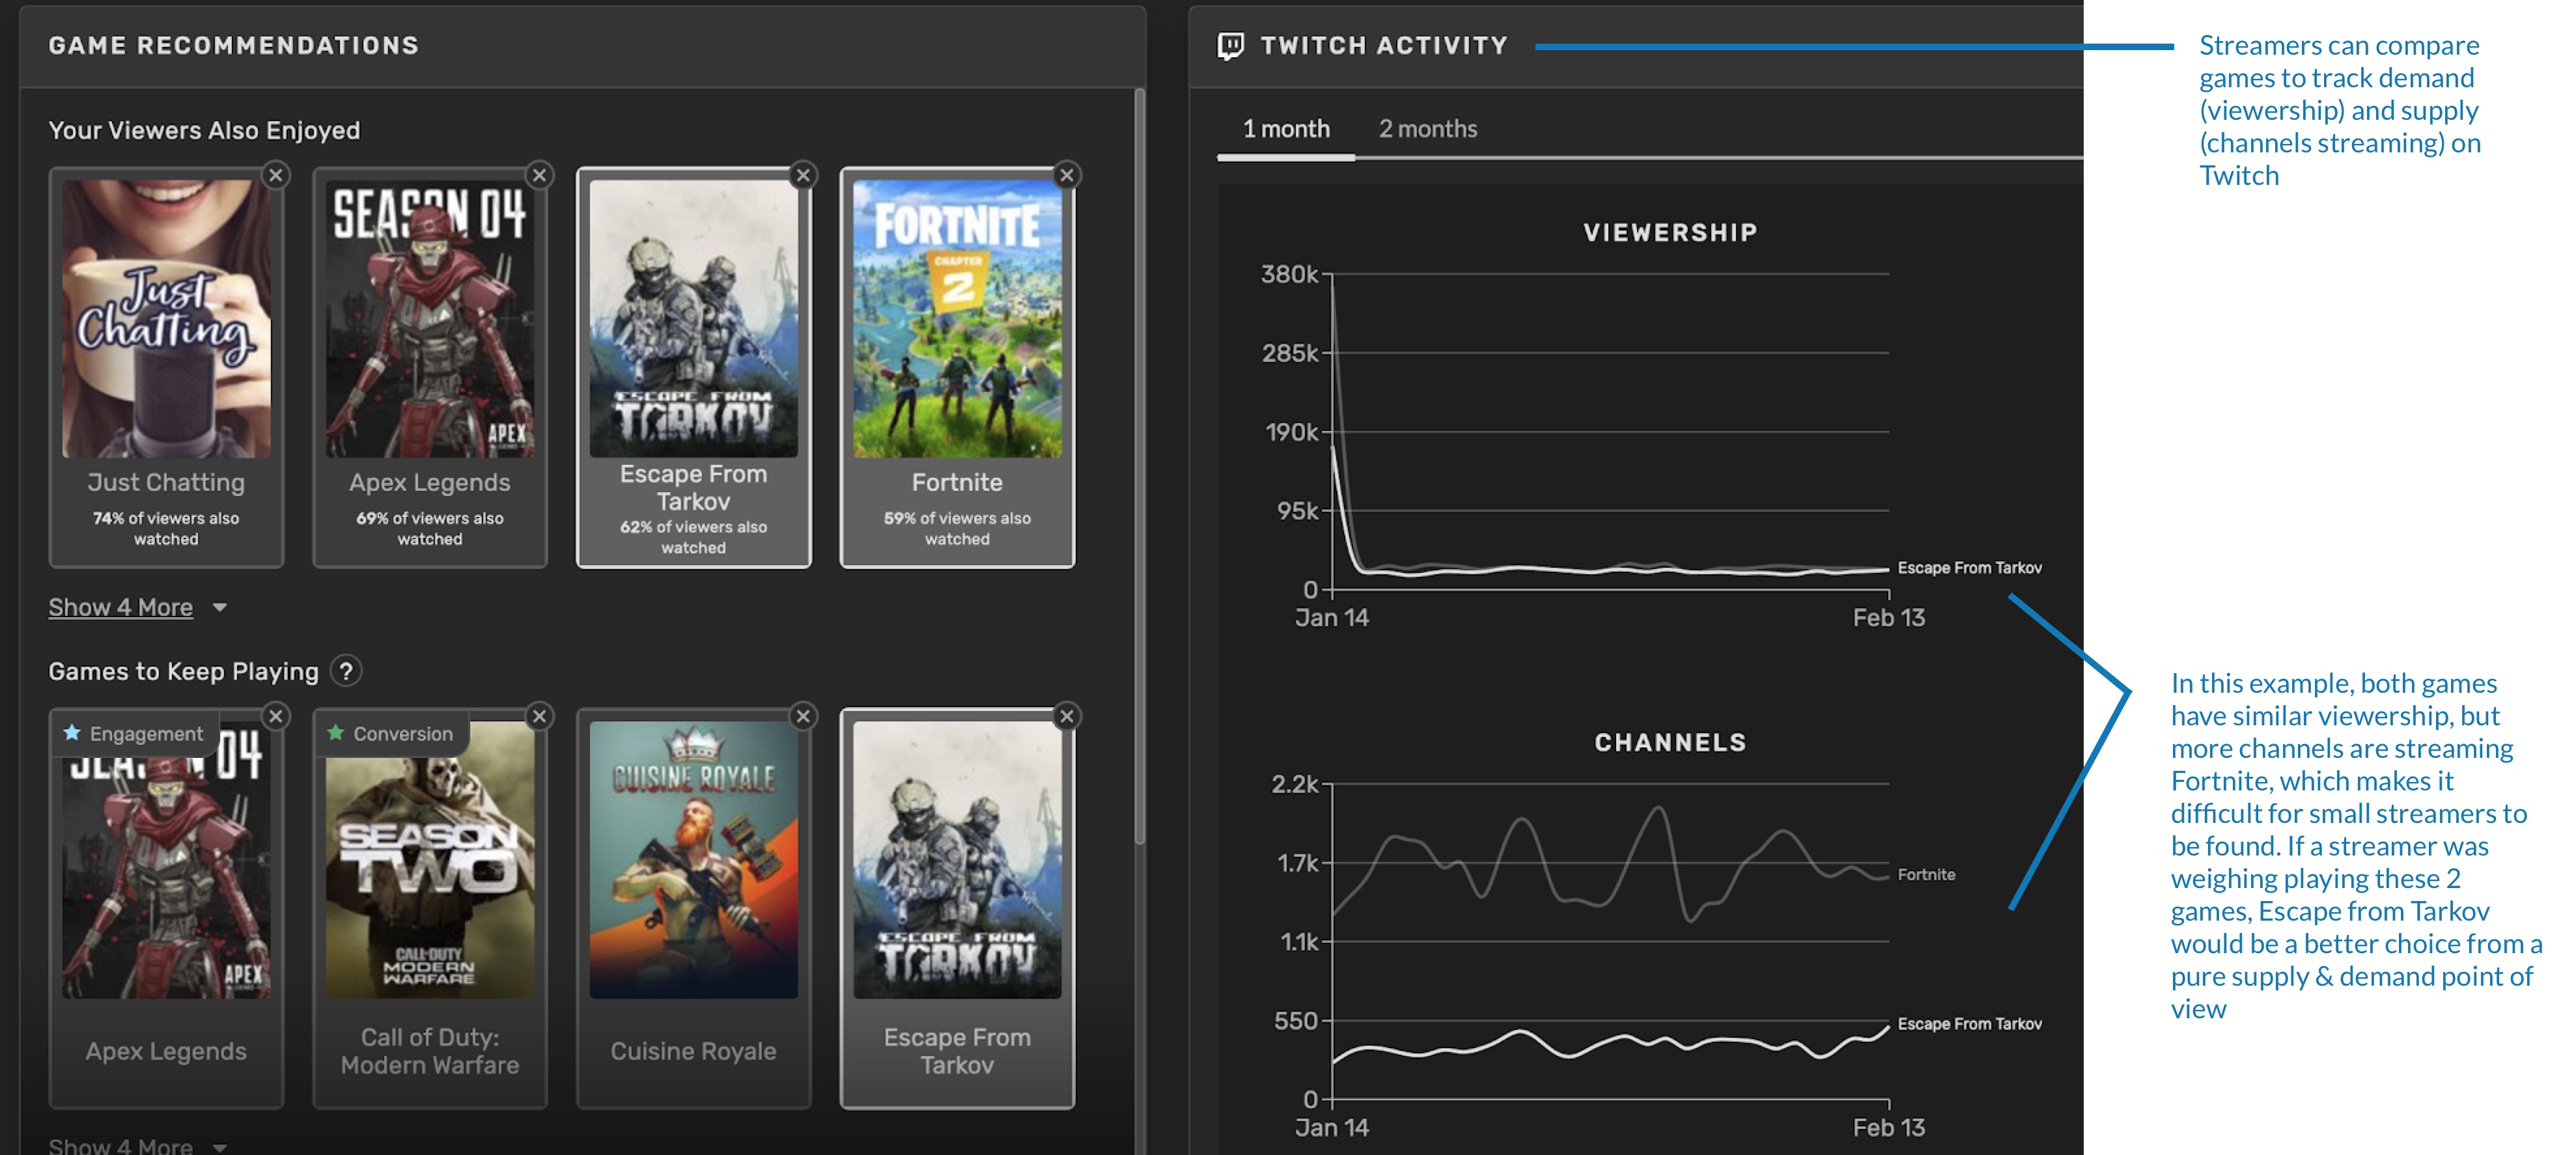
"What game should I play?" is the question most asked by game broadcasters. So we added personalized game recommendations, tuned to the individual broadcaster based on genres they often play and what their audience is interested in.
Recommendations are categorized based on games their viewers also watch in other channels, games that are performing above average for their channel (which means these are games they should continue to invest in), and new releases that are similar to games they already play.
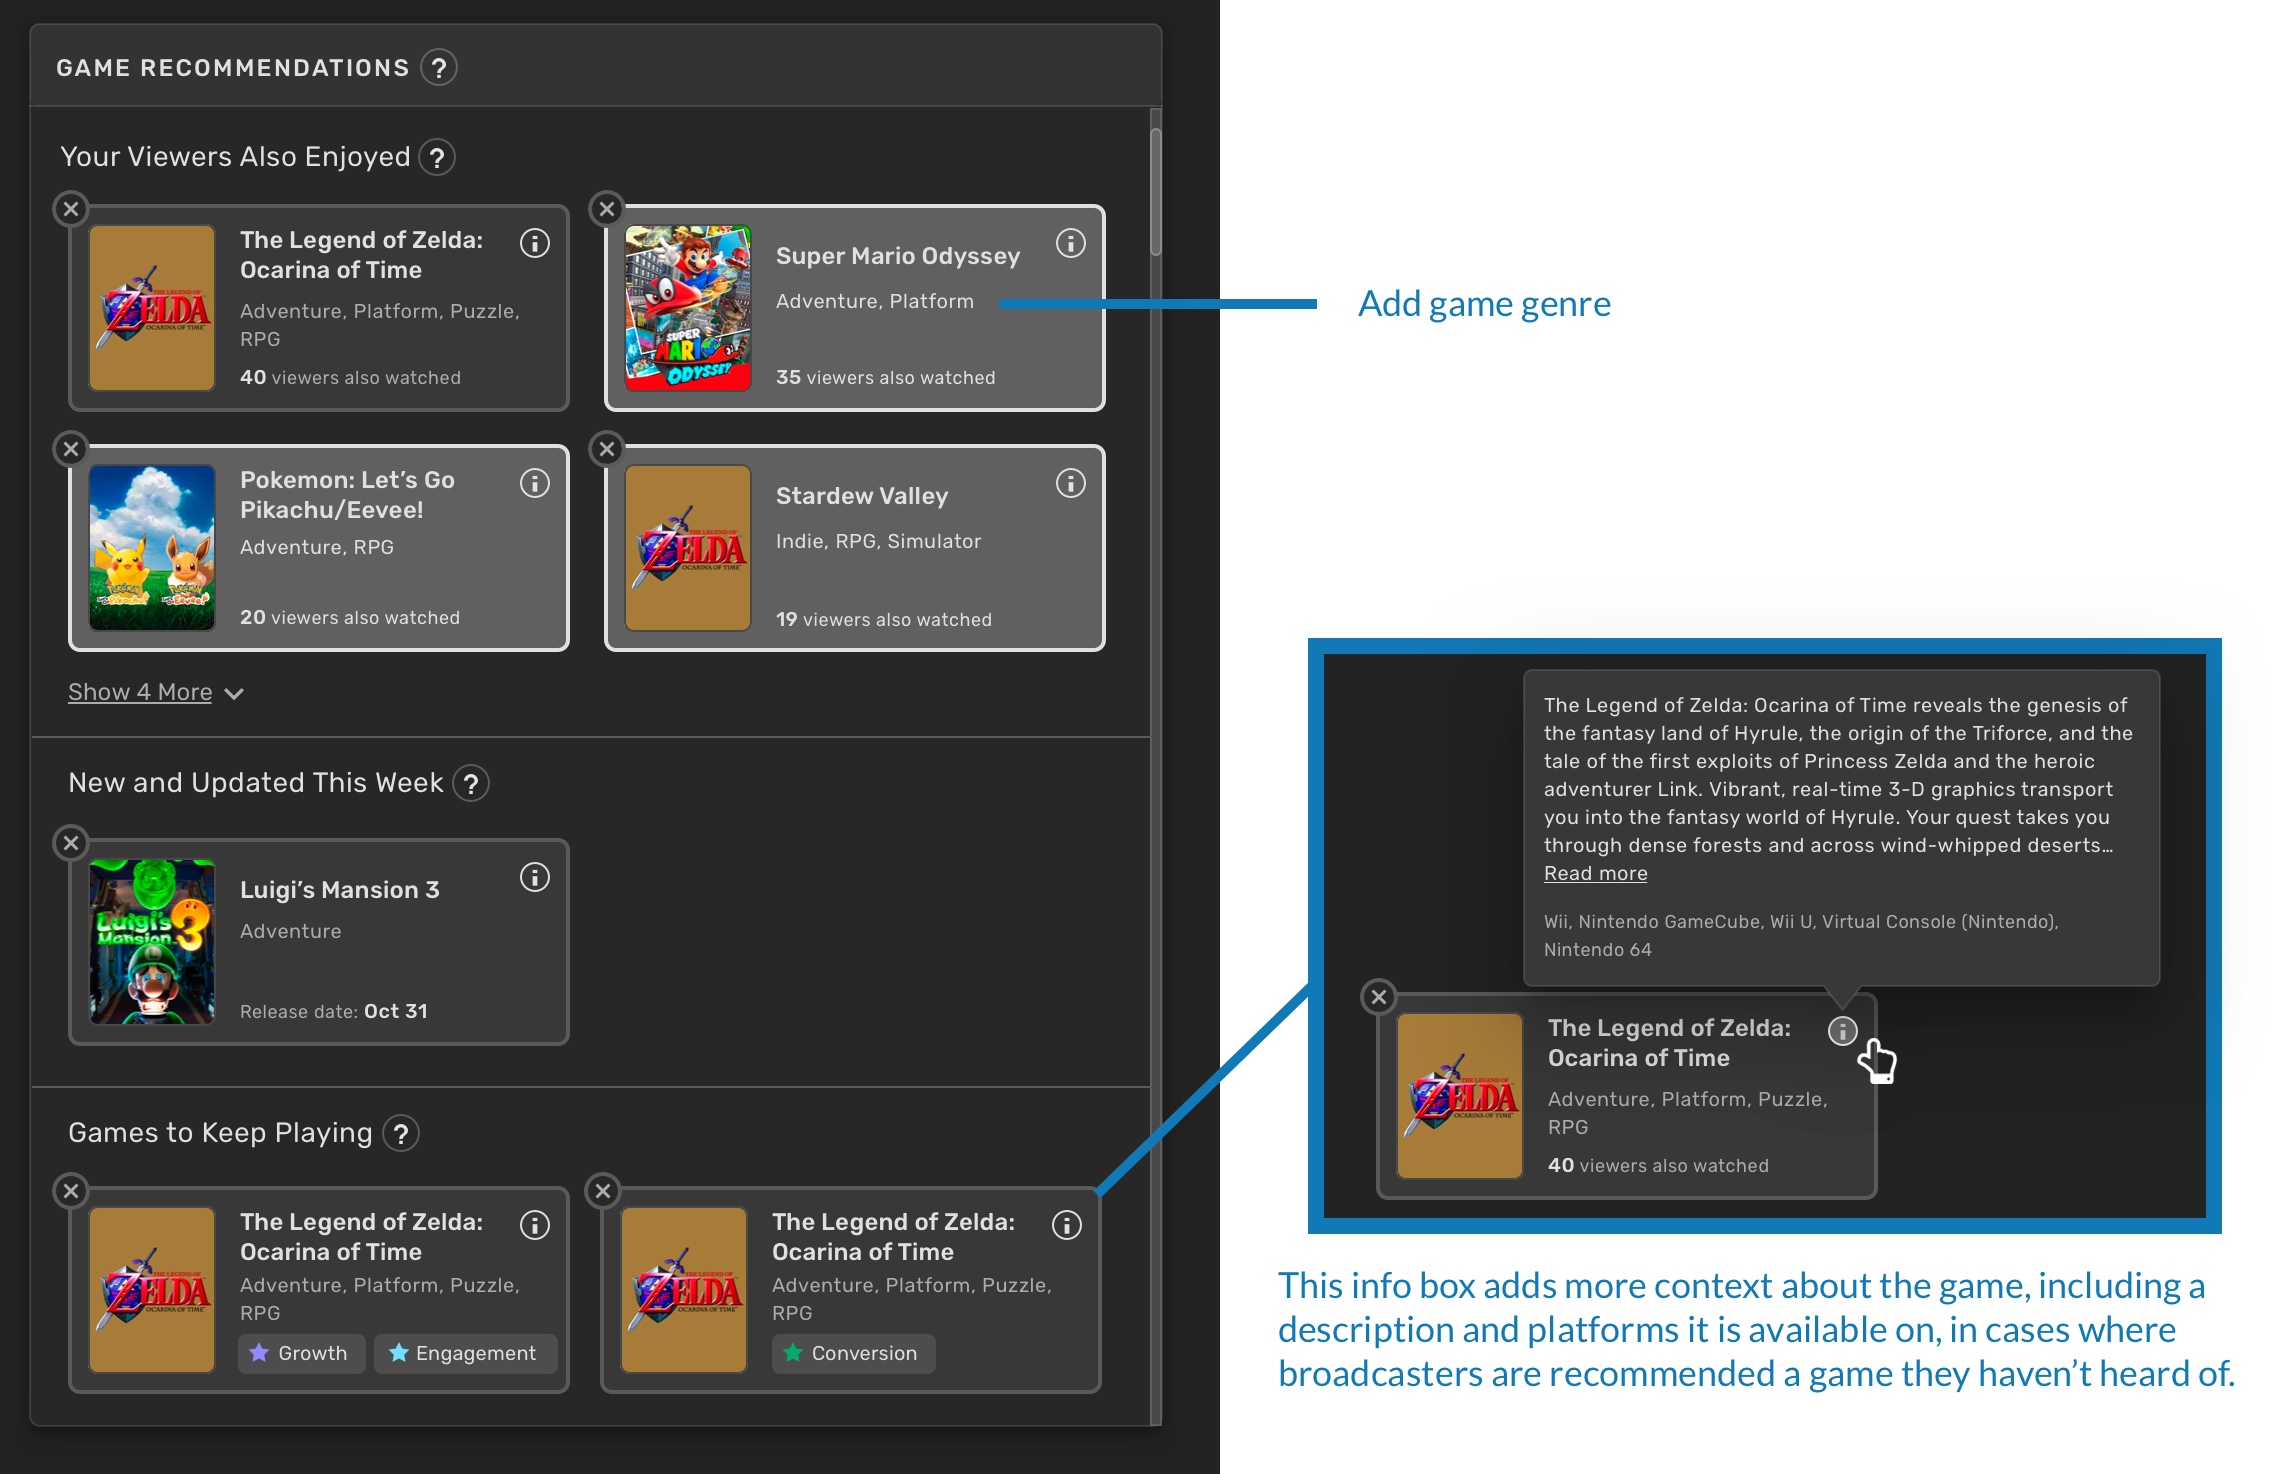
Based on feedback from the initial Game Recs release, we iterated on the design to add more information about each game. Boadcasters can review the game description, genre, and platform here, so that users don't have to google for it separately if they are unfamiliar with a title, and so they can evaluate whether a game fits their current play style. (This iteration, however, was not able to be implemented.)
Impact
The MVP launched to an initial cohort of streamers in August 2019, netting out at 24% retention - our key metric at this stage. After adding subsequent features (the stream drilldown, personalized recommendations, as well as light modifications to Insights page) over the next few months, we then onboarded a second cohort of streamers which resulted in 56% retention (a +32% improvement).
Future Designs
By now, we've gathered enough data through surveys and conversations with our alpha users to evolve the main Insights dashboard. The next evolution of the Insights dashboard was prototyped and tested out, but was not implemented as by that time the company was about to be acquired.
Insights Update Goals
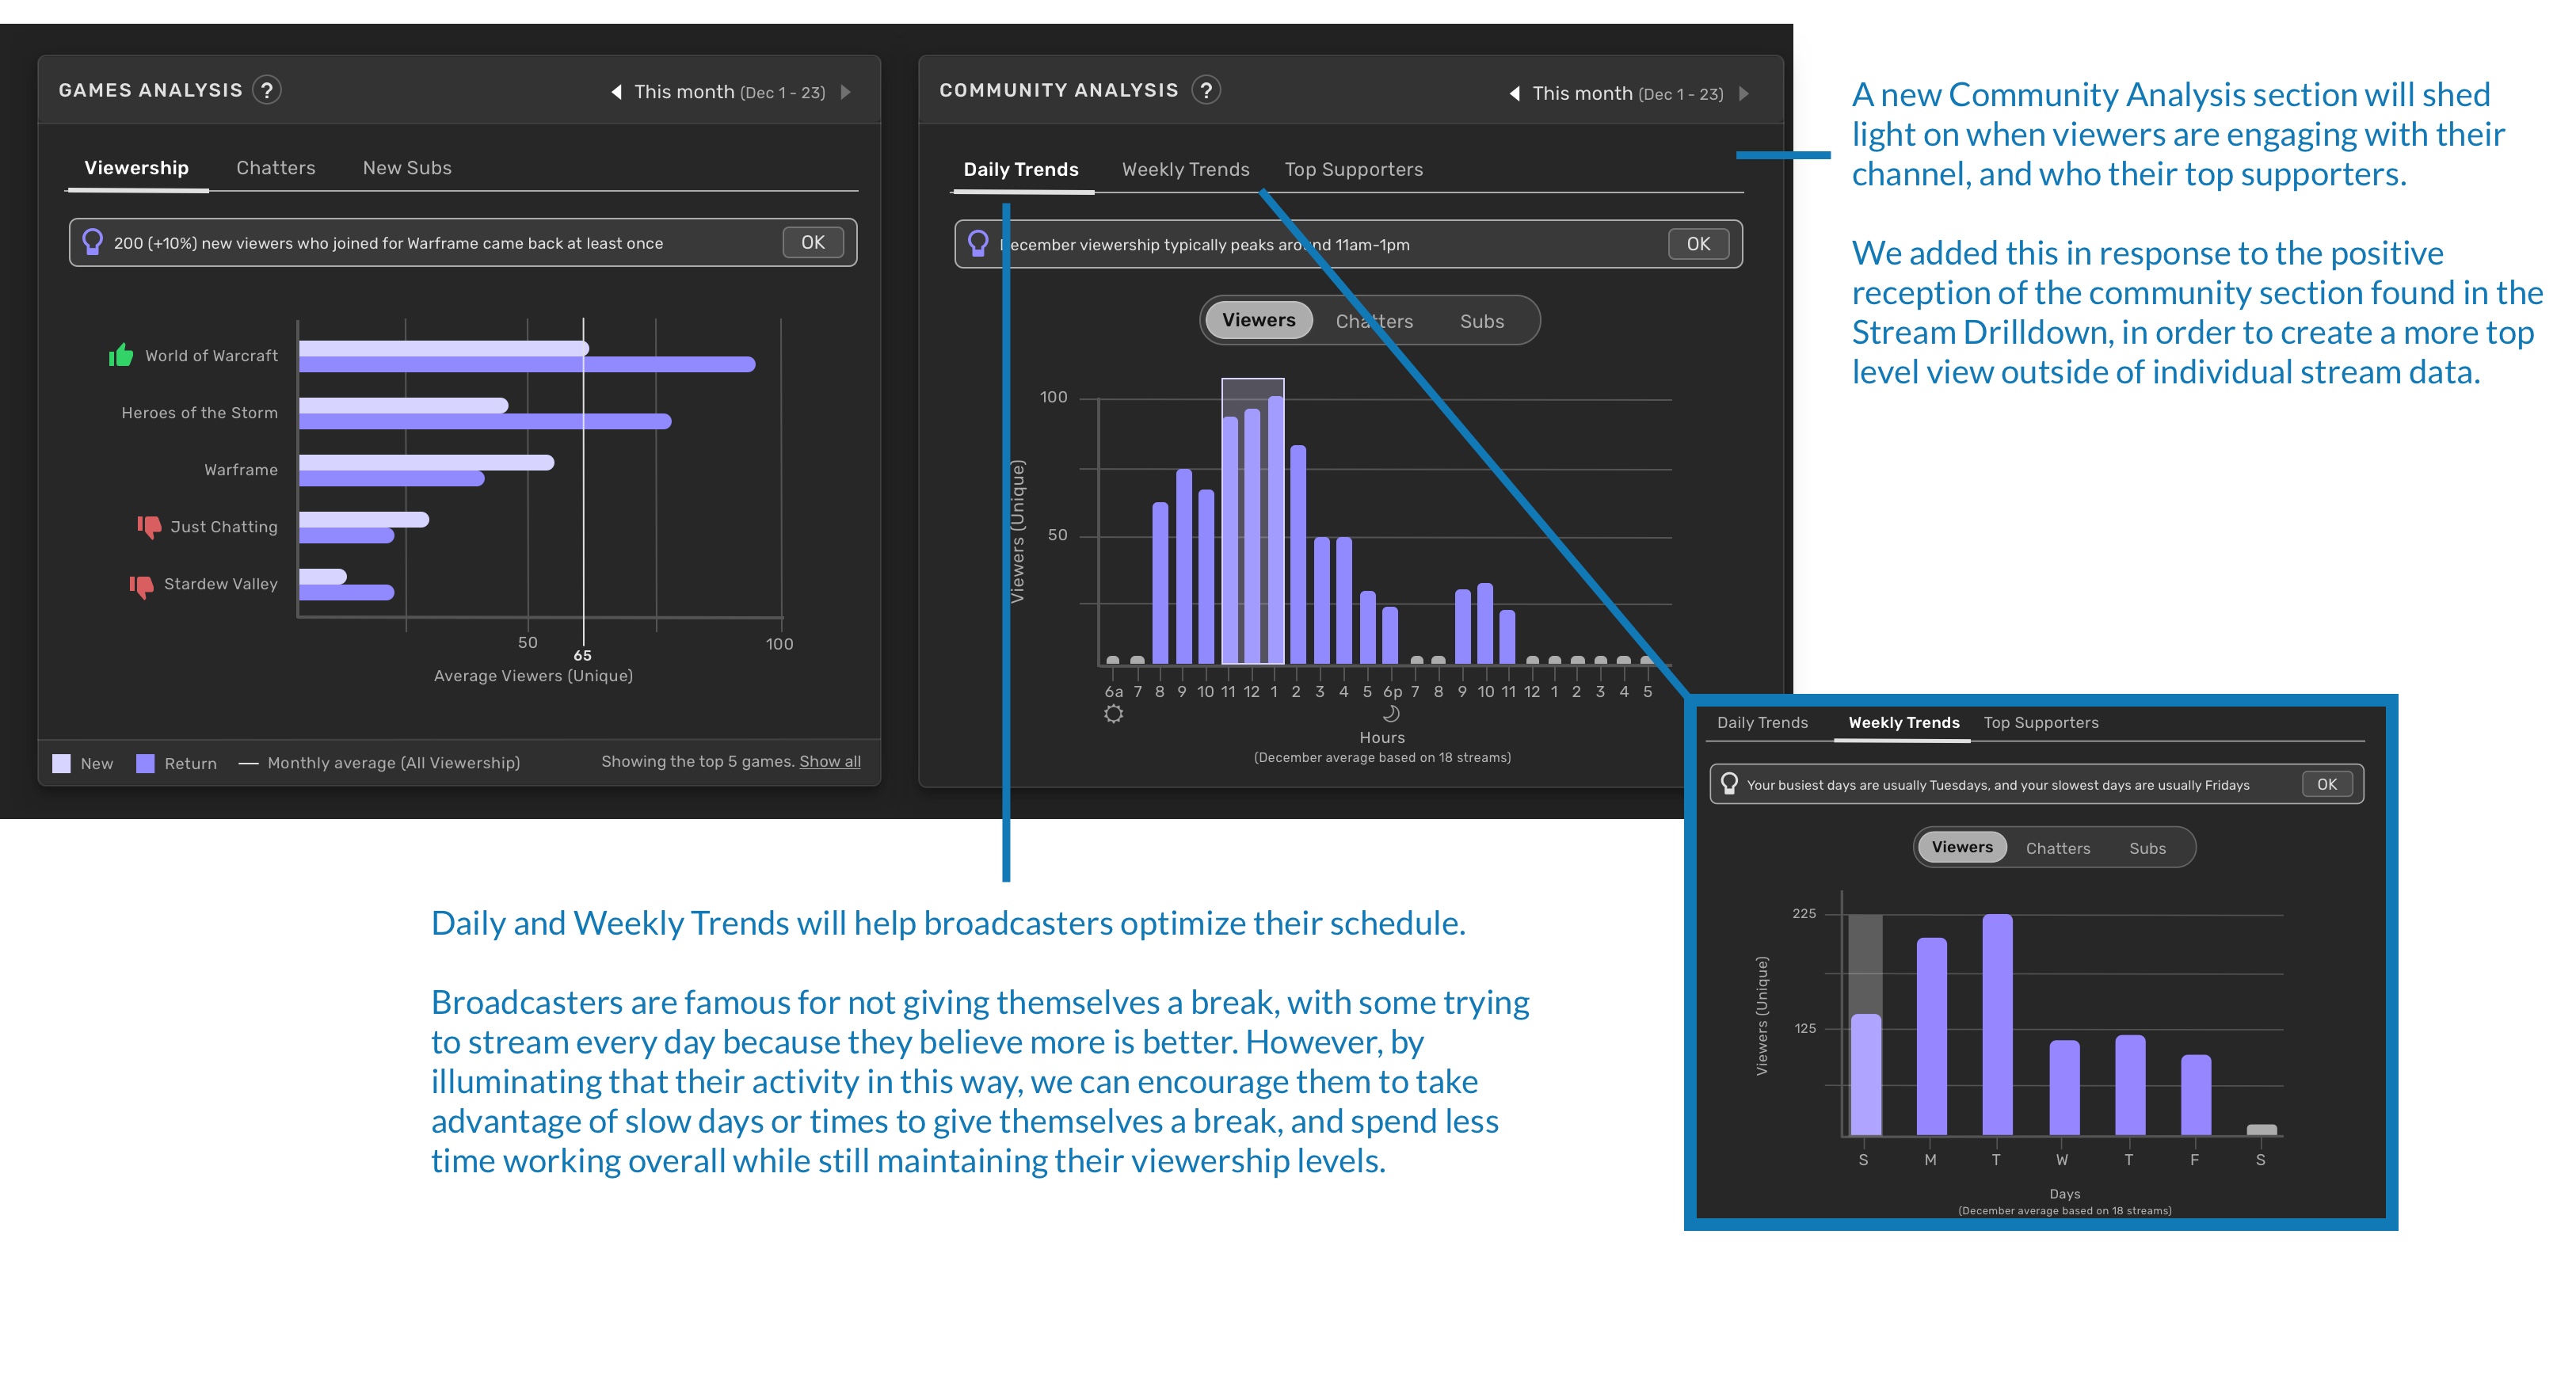
1. Help streamers optimize their time for the most impact
2. Many streamers are unsure what to do with the data, and have trouble differentiating signal from noise - help streamers turn insights into action.
3. Single gamers (users who stick to one game and don’t rotate their catalog) don’t retain past 1-2 visits - find ways to add value outside of games played.
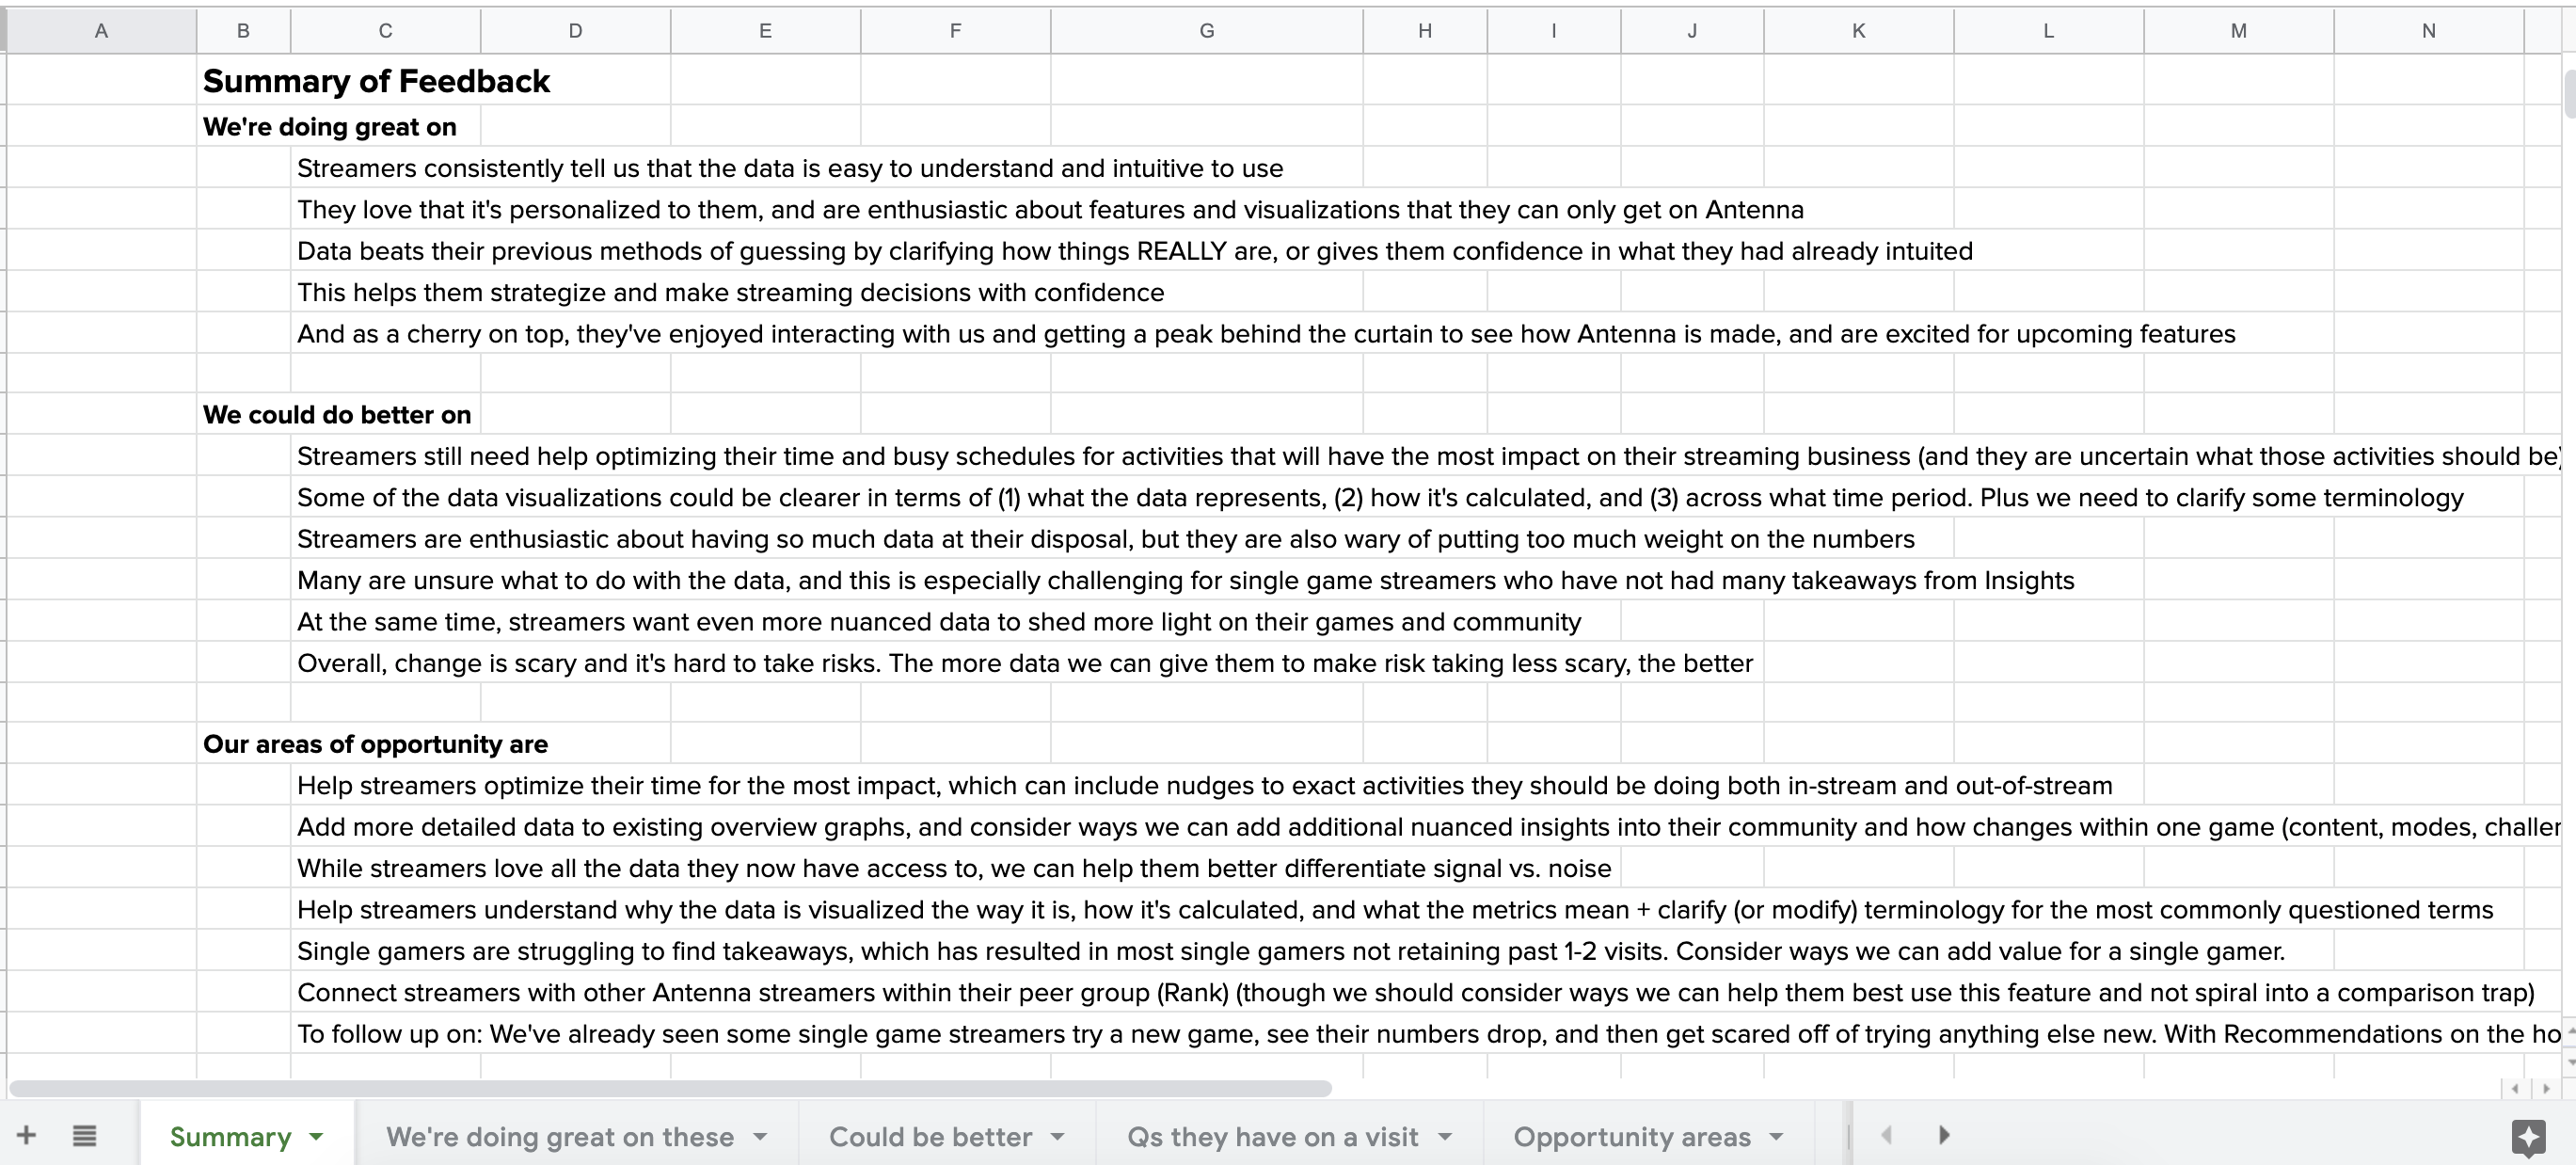
Excerpt from our feedback synthesis
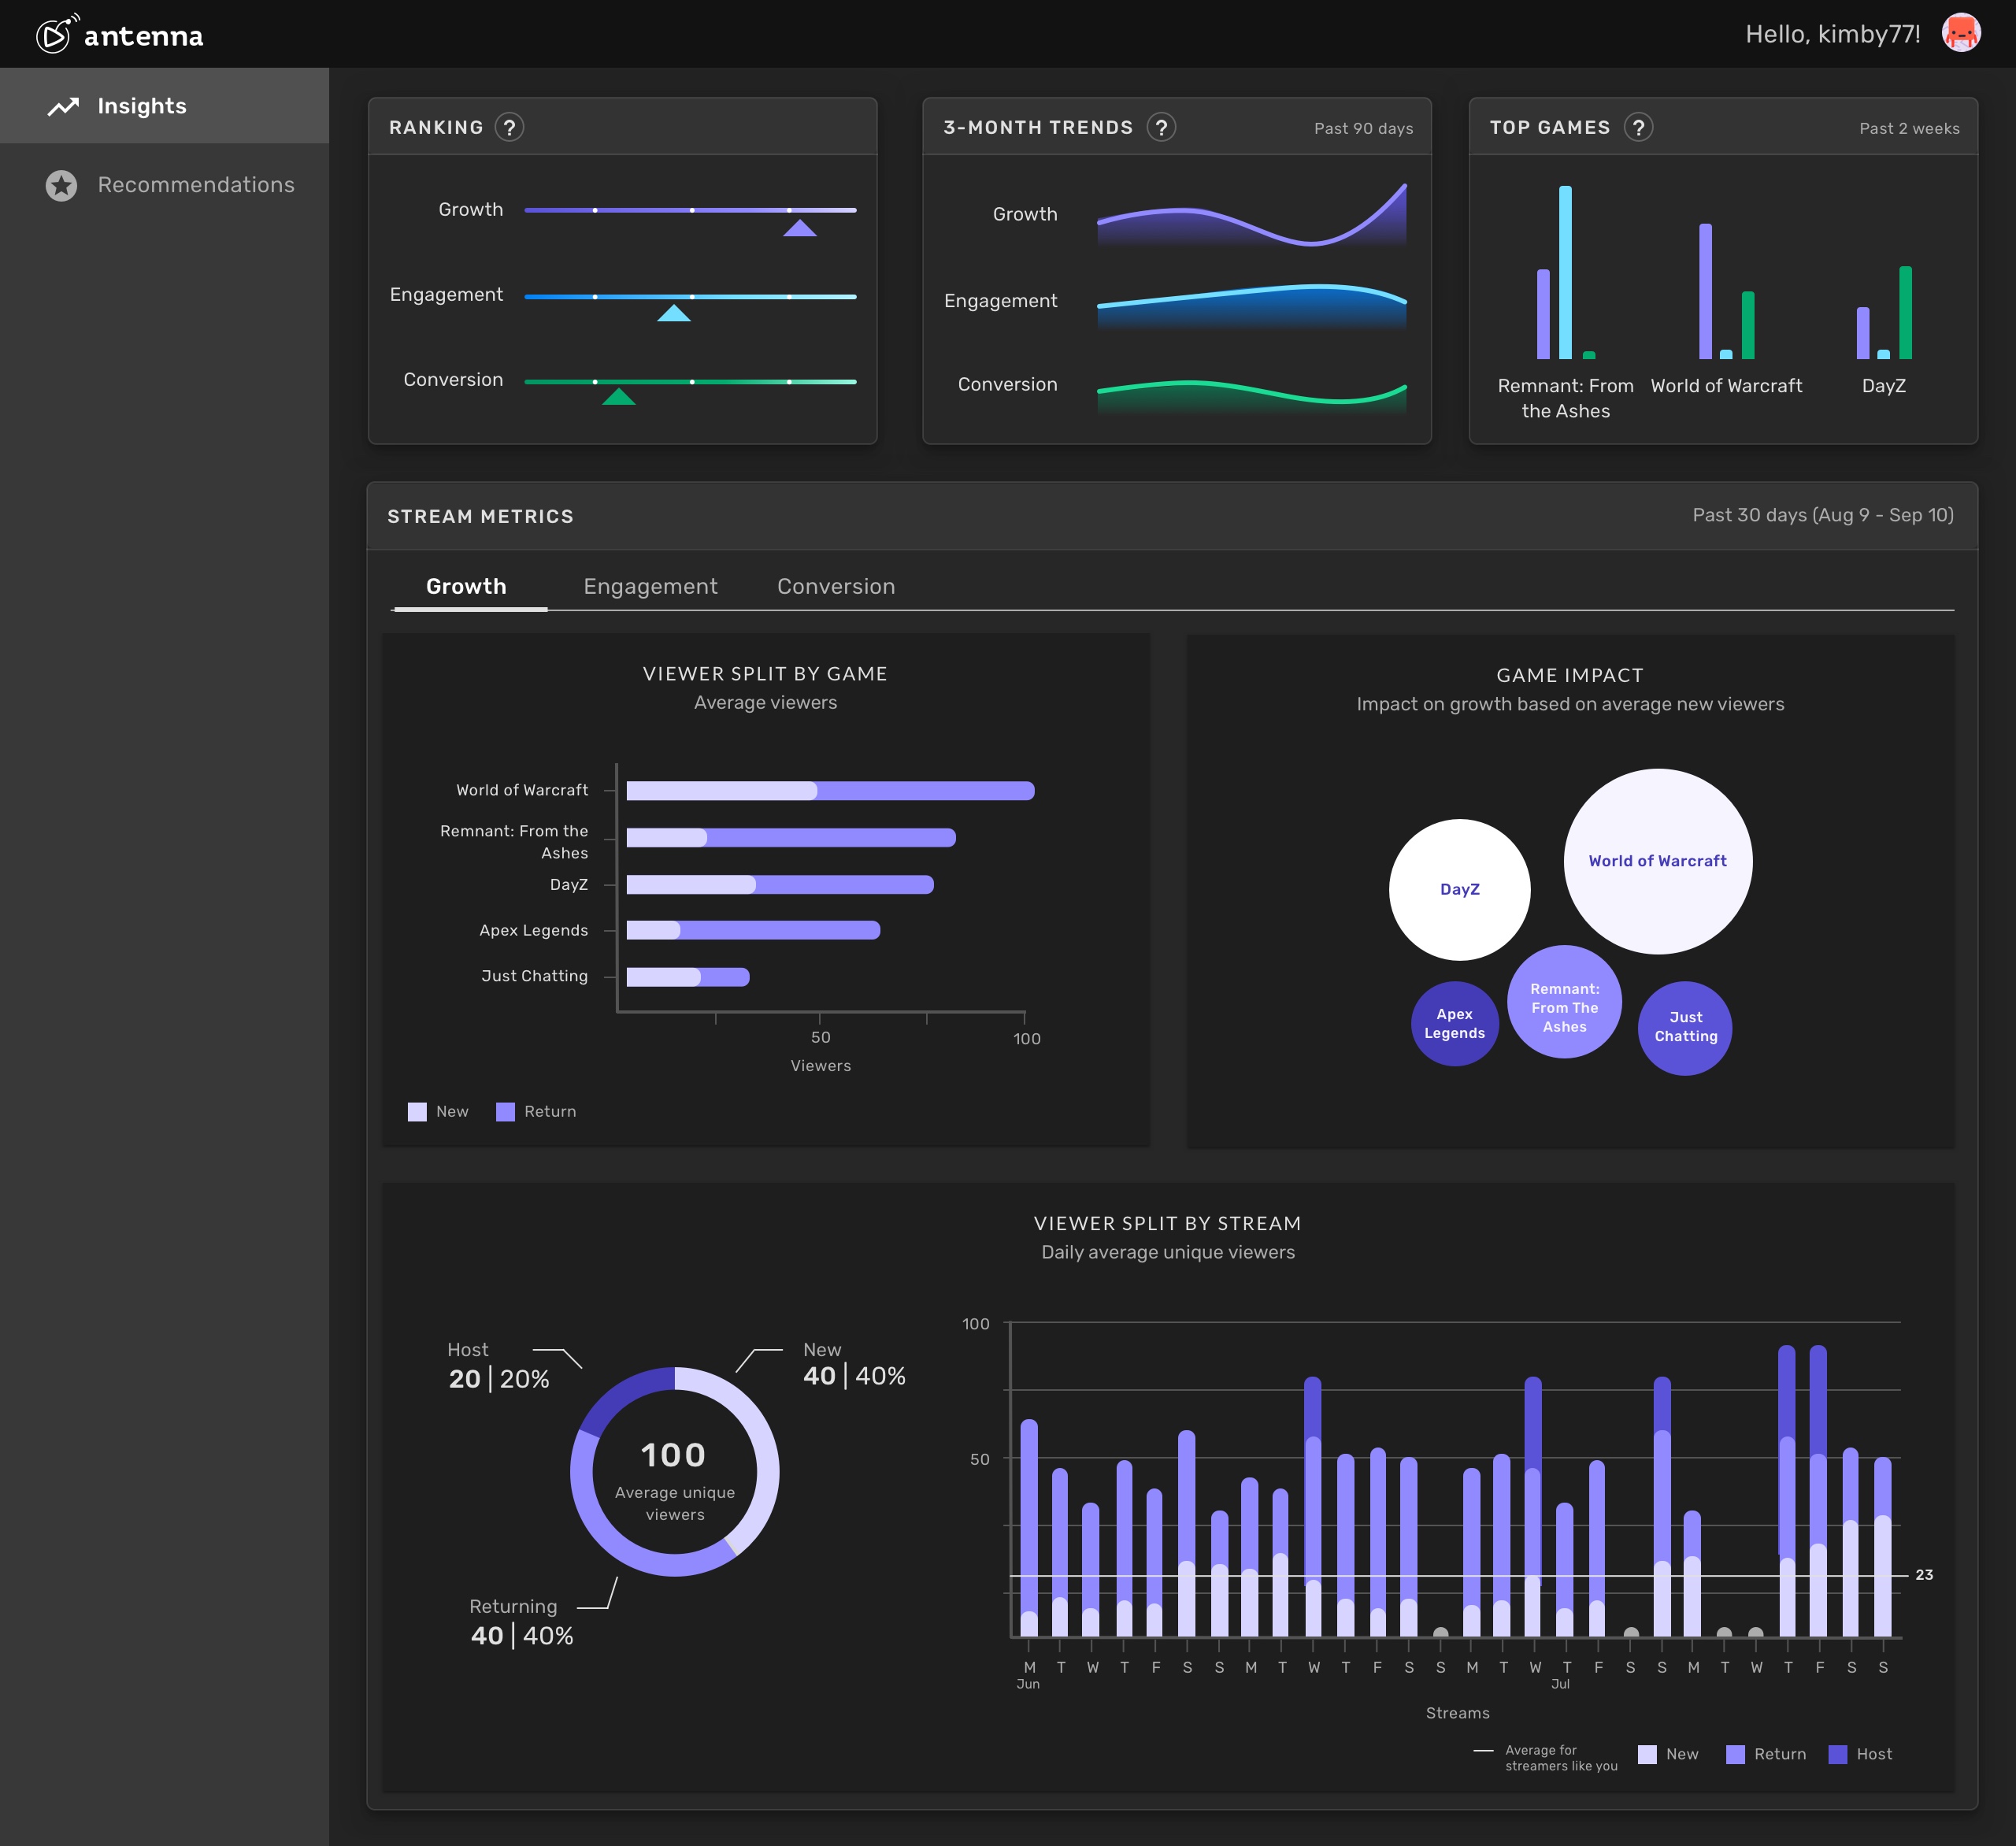
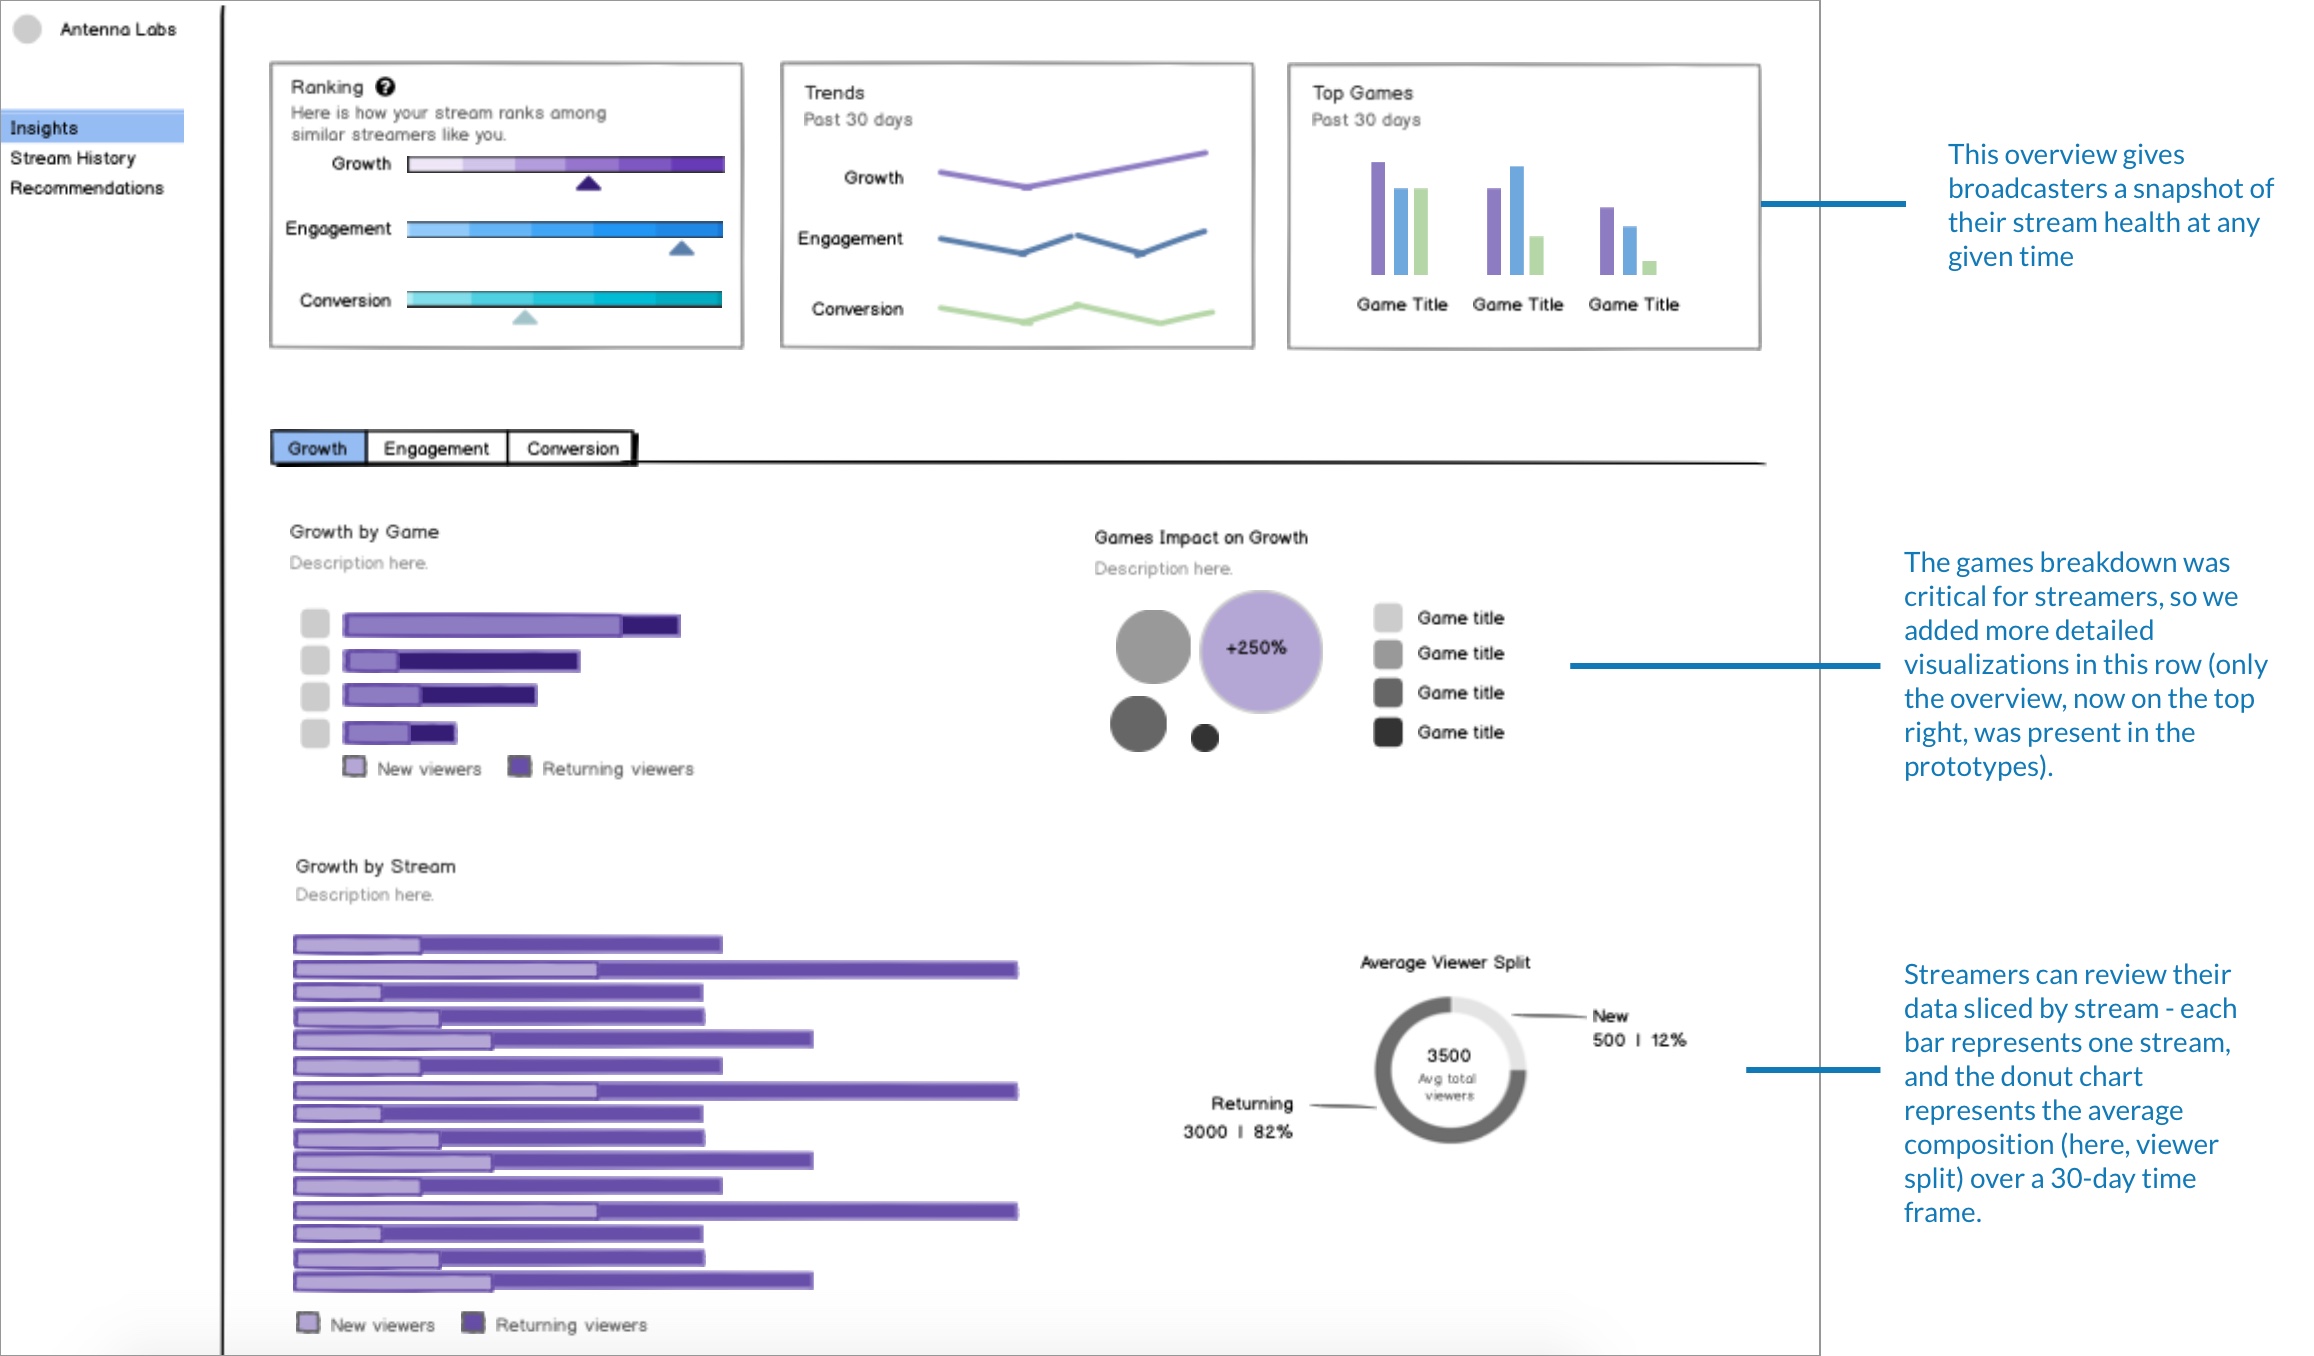
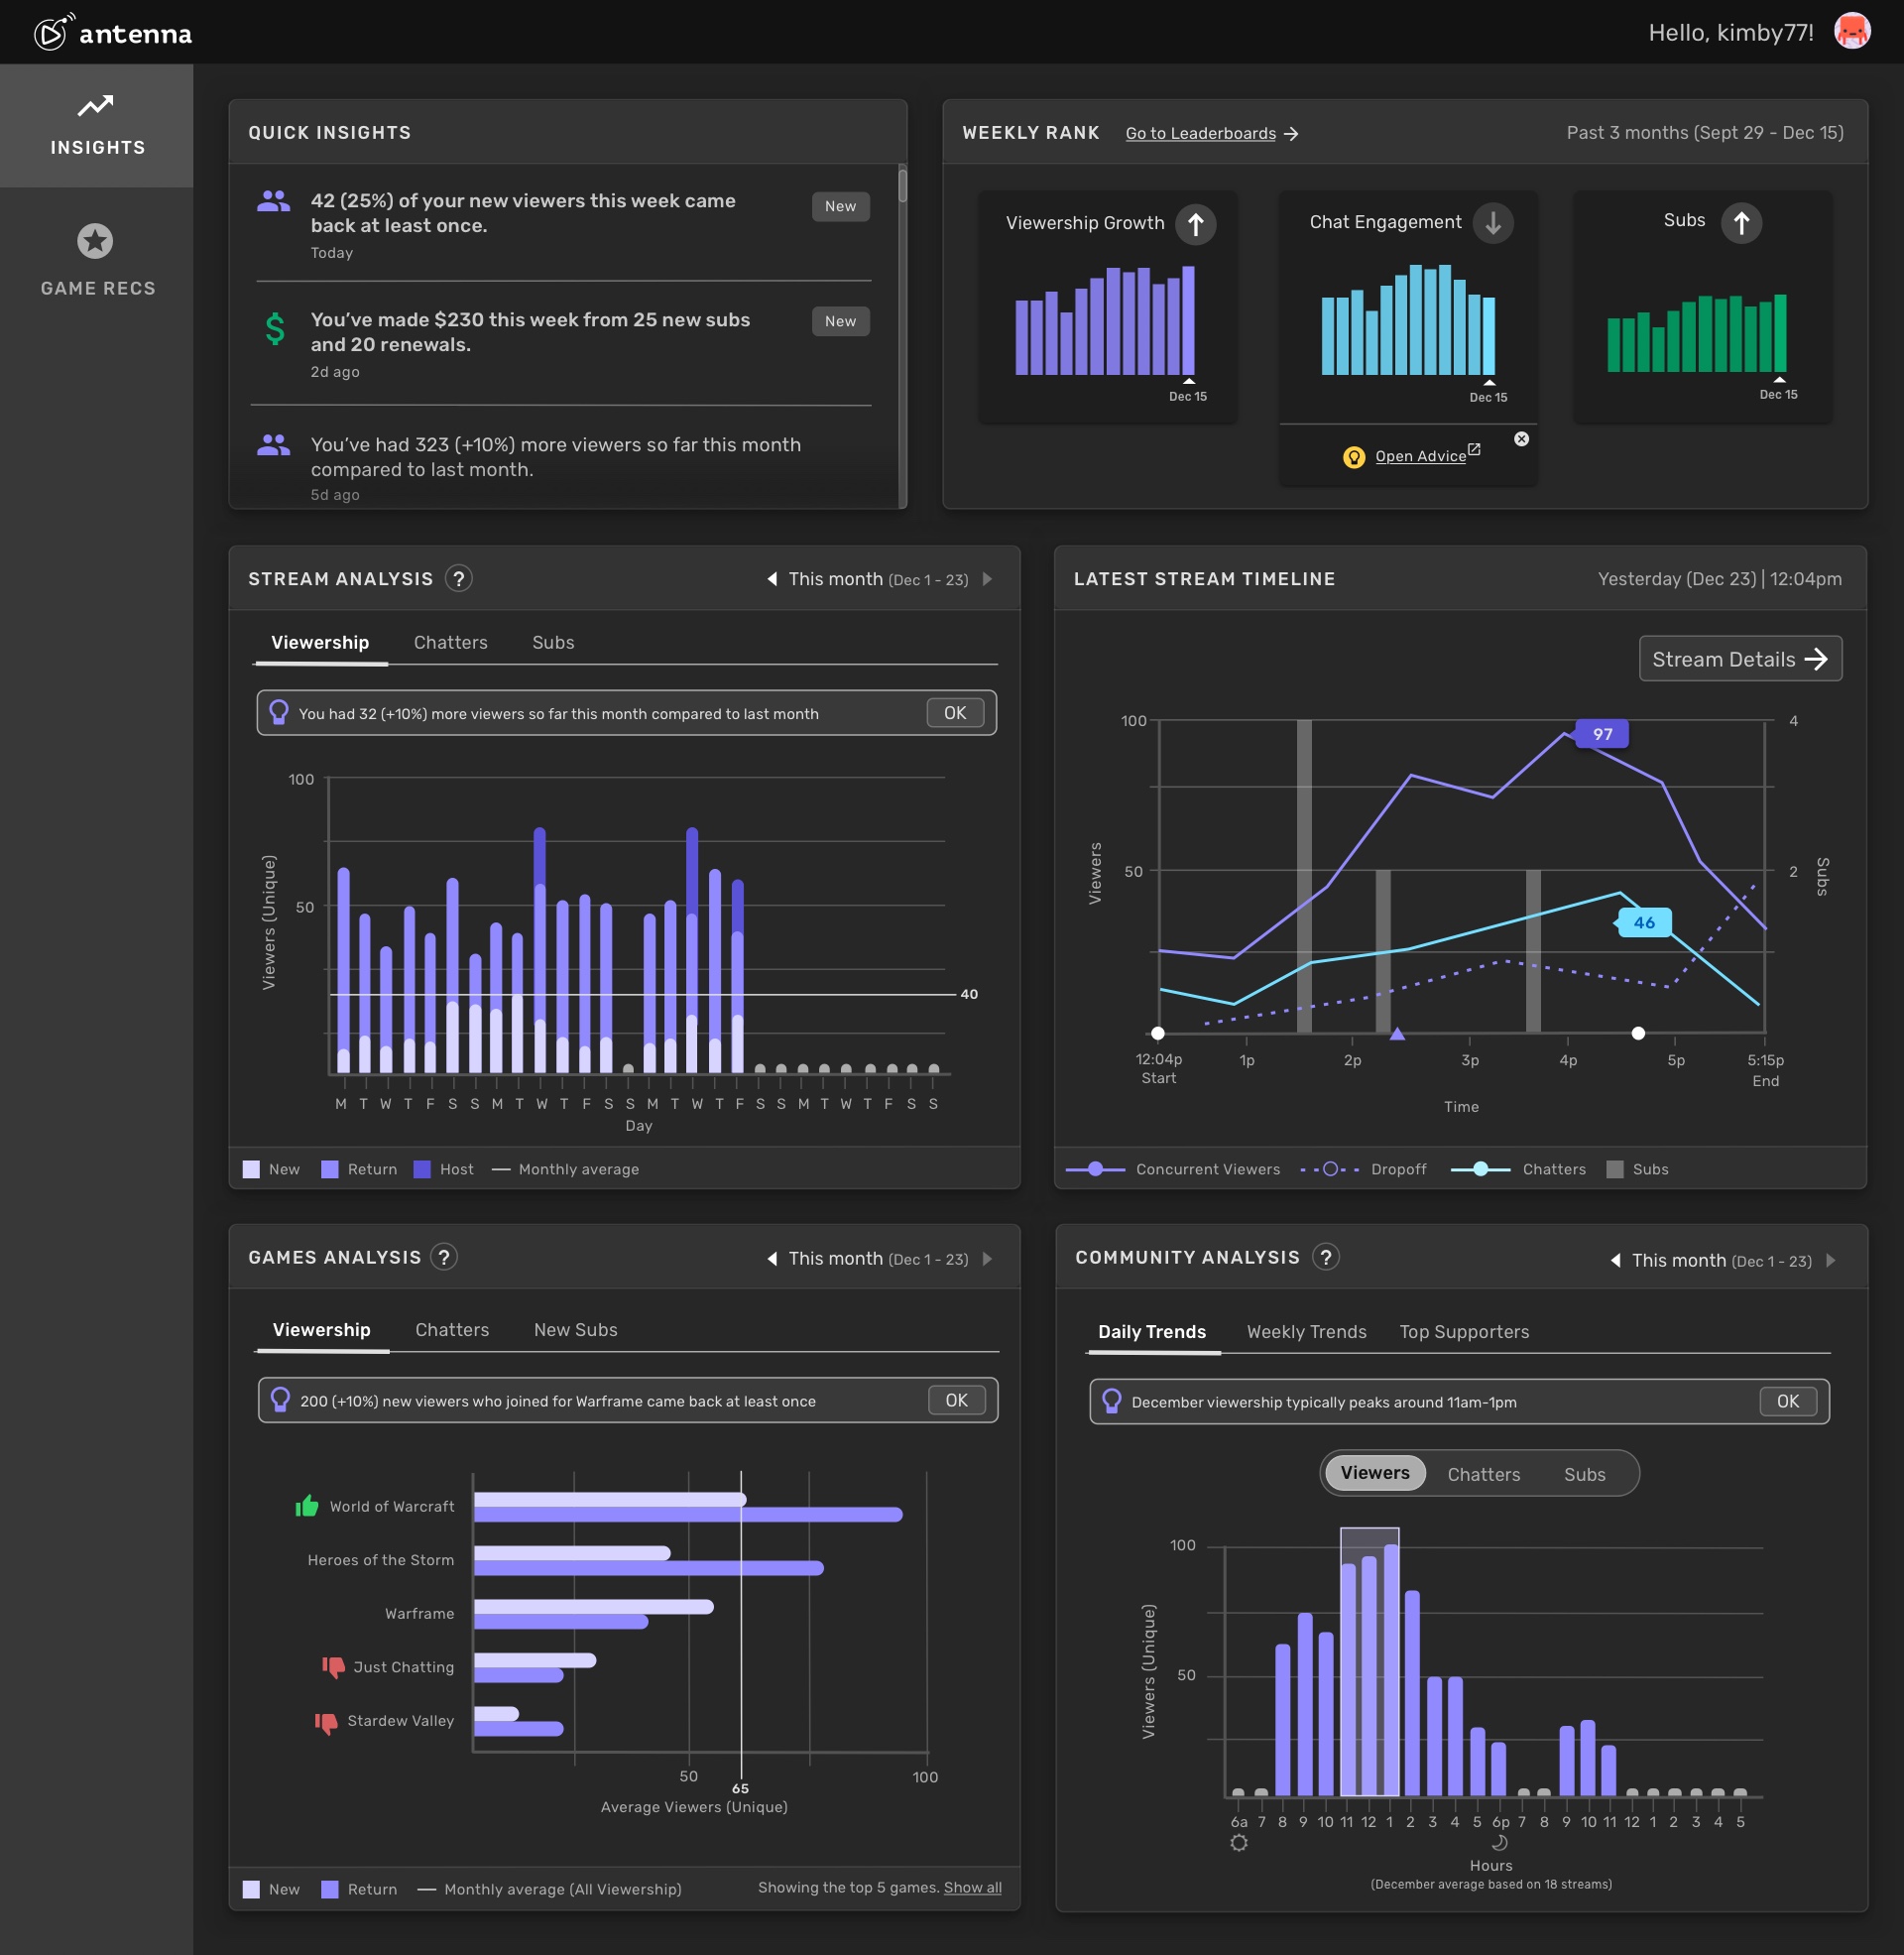
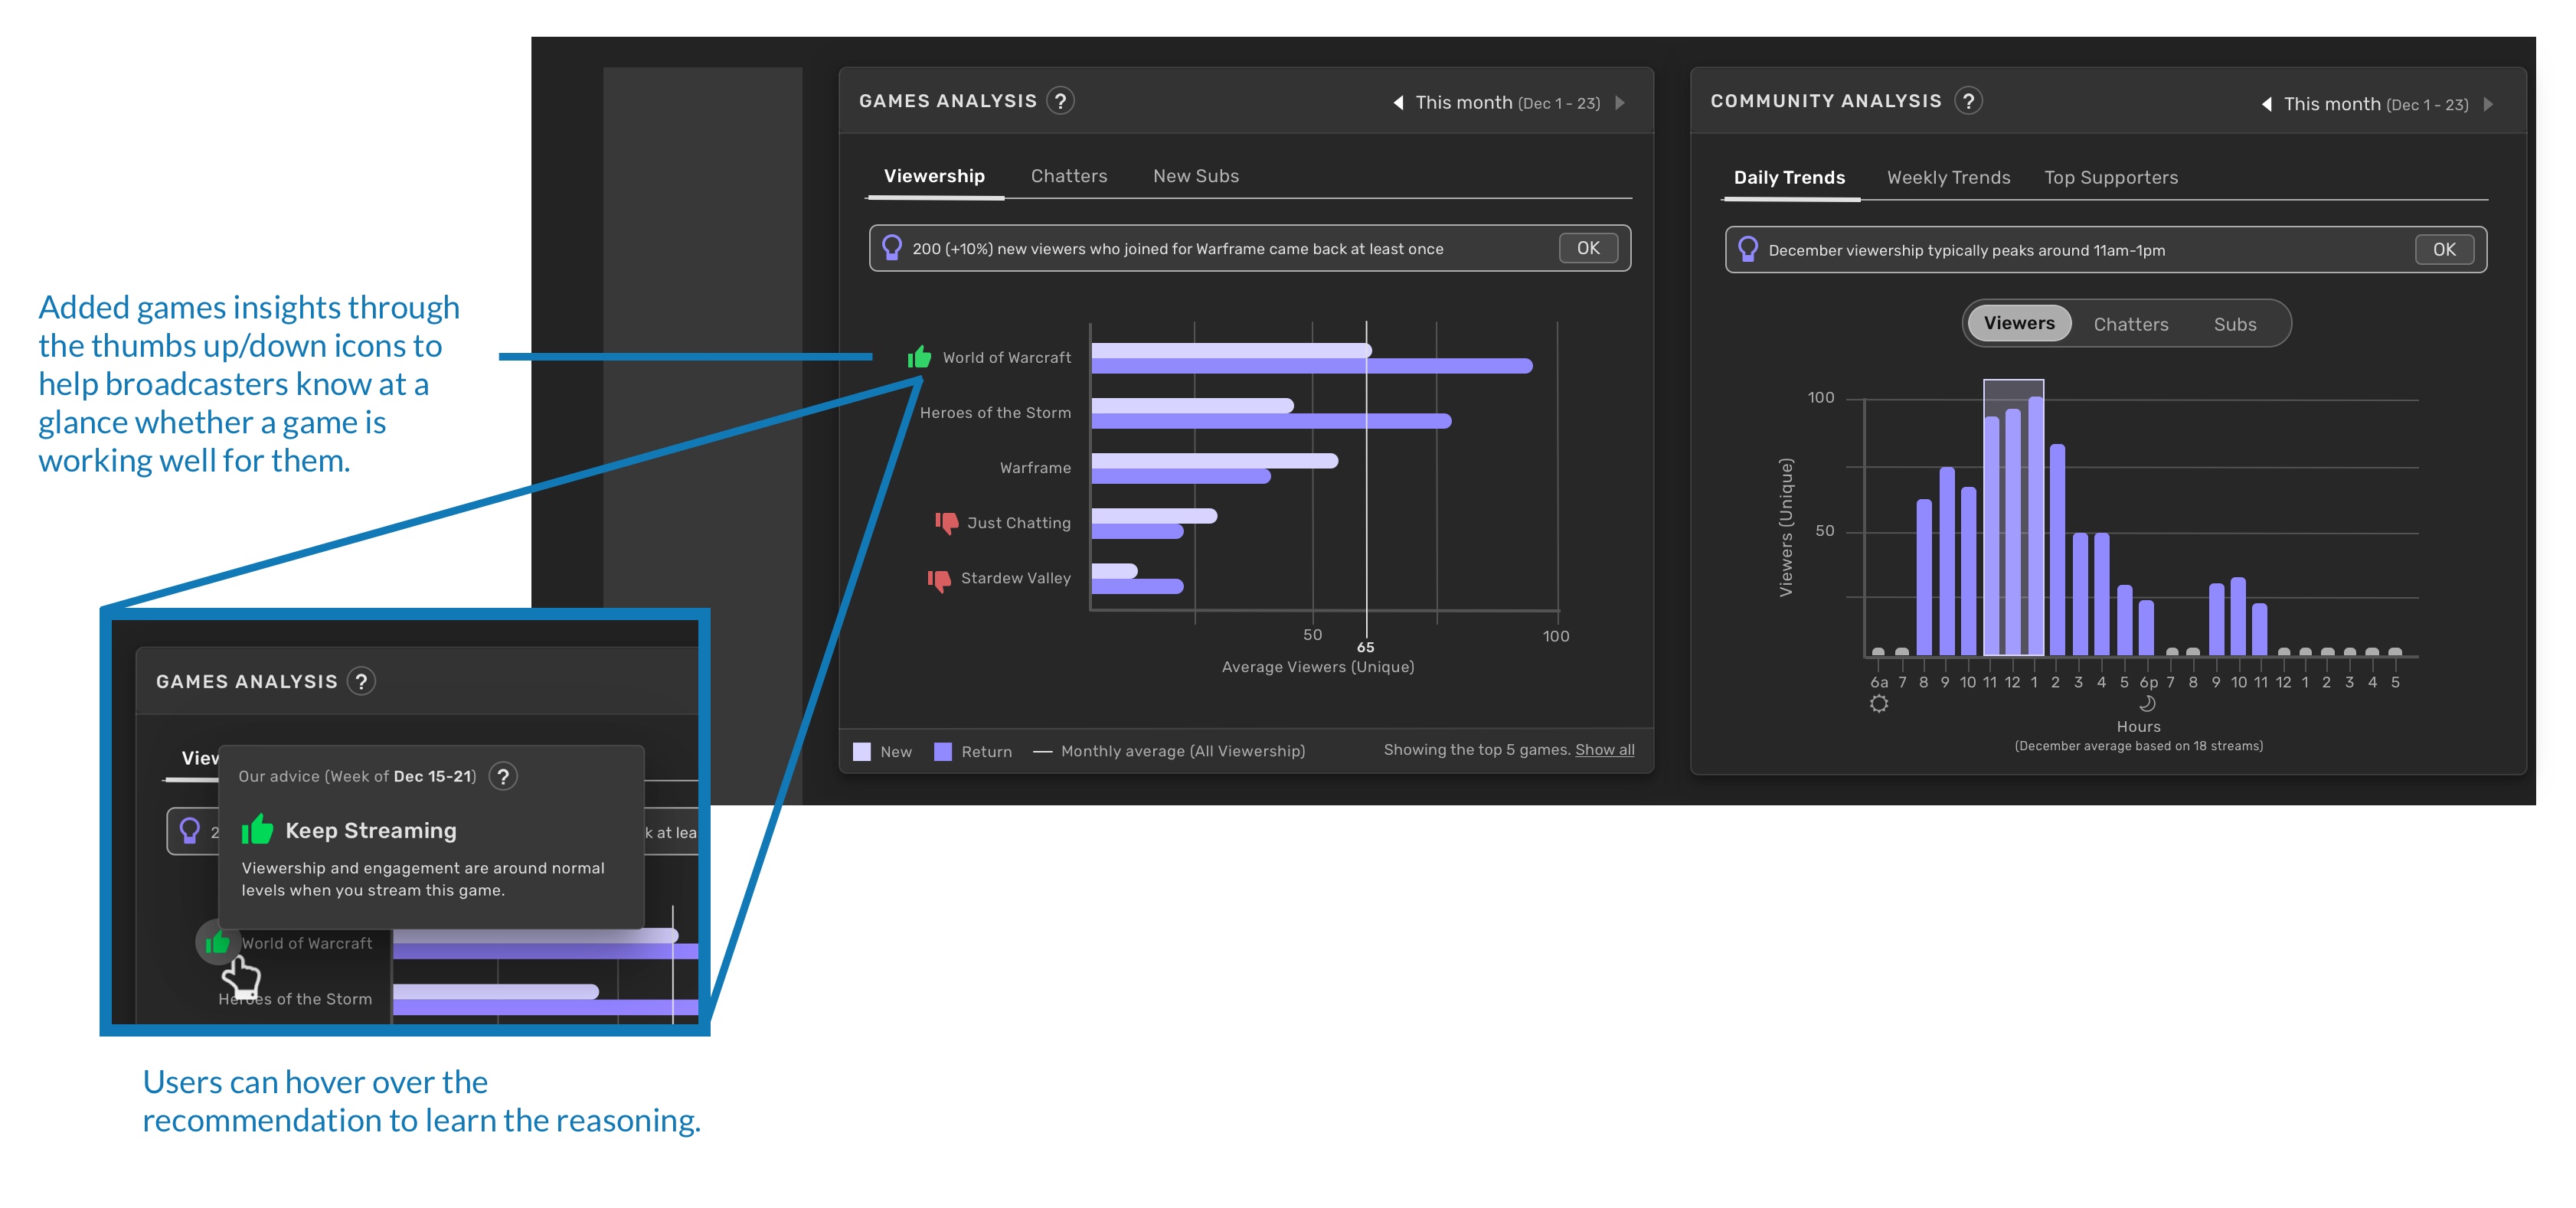
Updated Insights Dashboard
This revised design was reported to be easier to skim and digest compared to the current product, while at the same time increasing the amount of detail and data available (something our users consistently asked for!)
© Kim Kiser Ramirez 2020